Canopy Analytics
An Interactive Resource for Tree Discovery in the Portland Metro Area
Jackson Voelkel, Geospatial Research Analyst |Portland Metro Area Trees
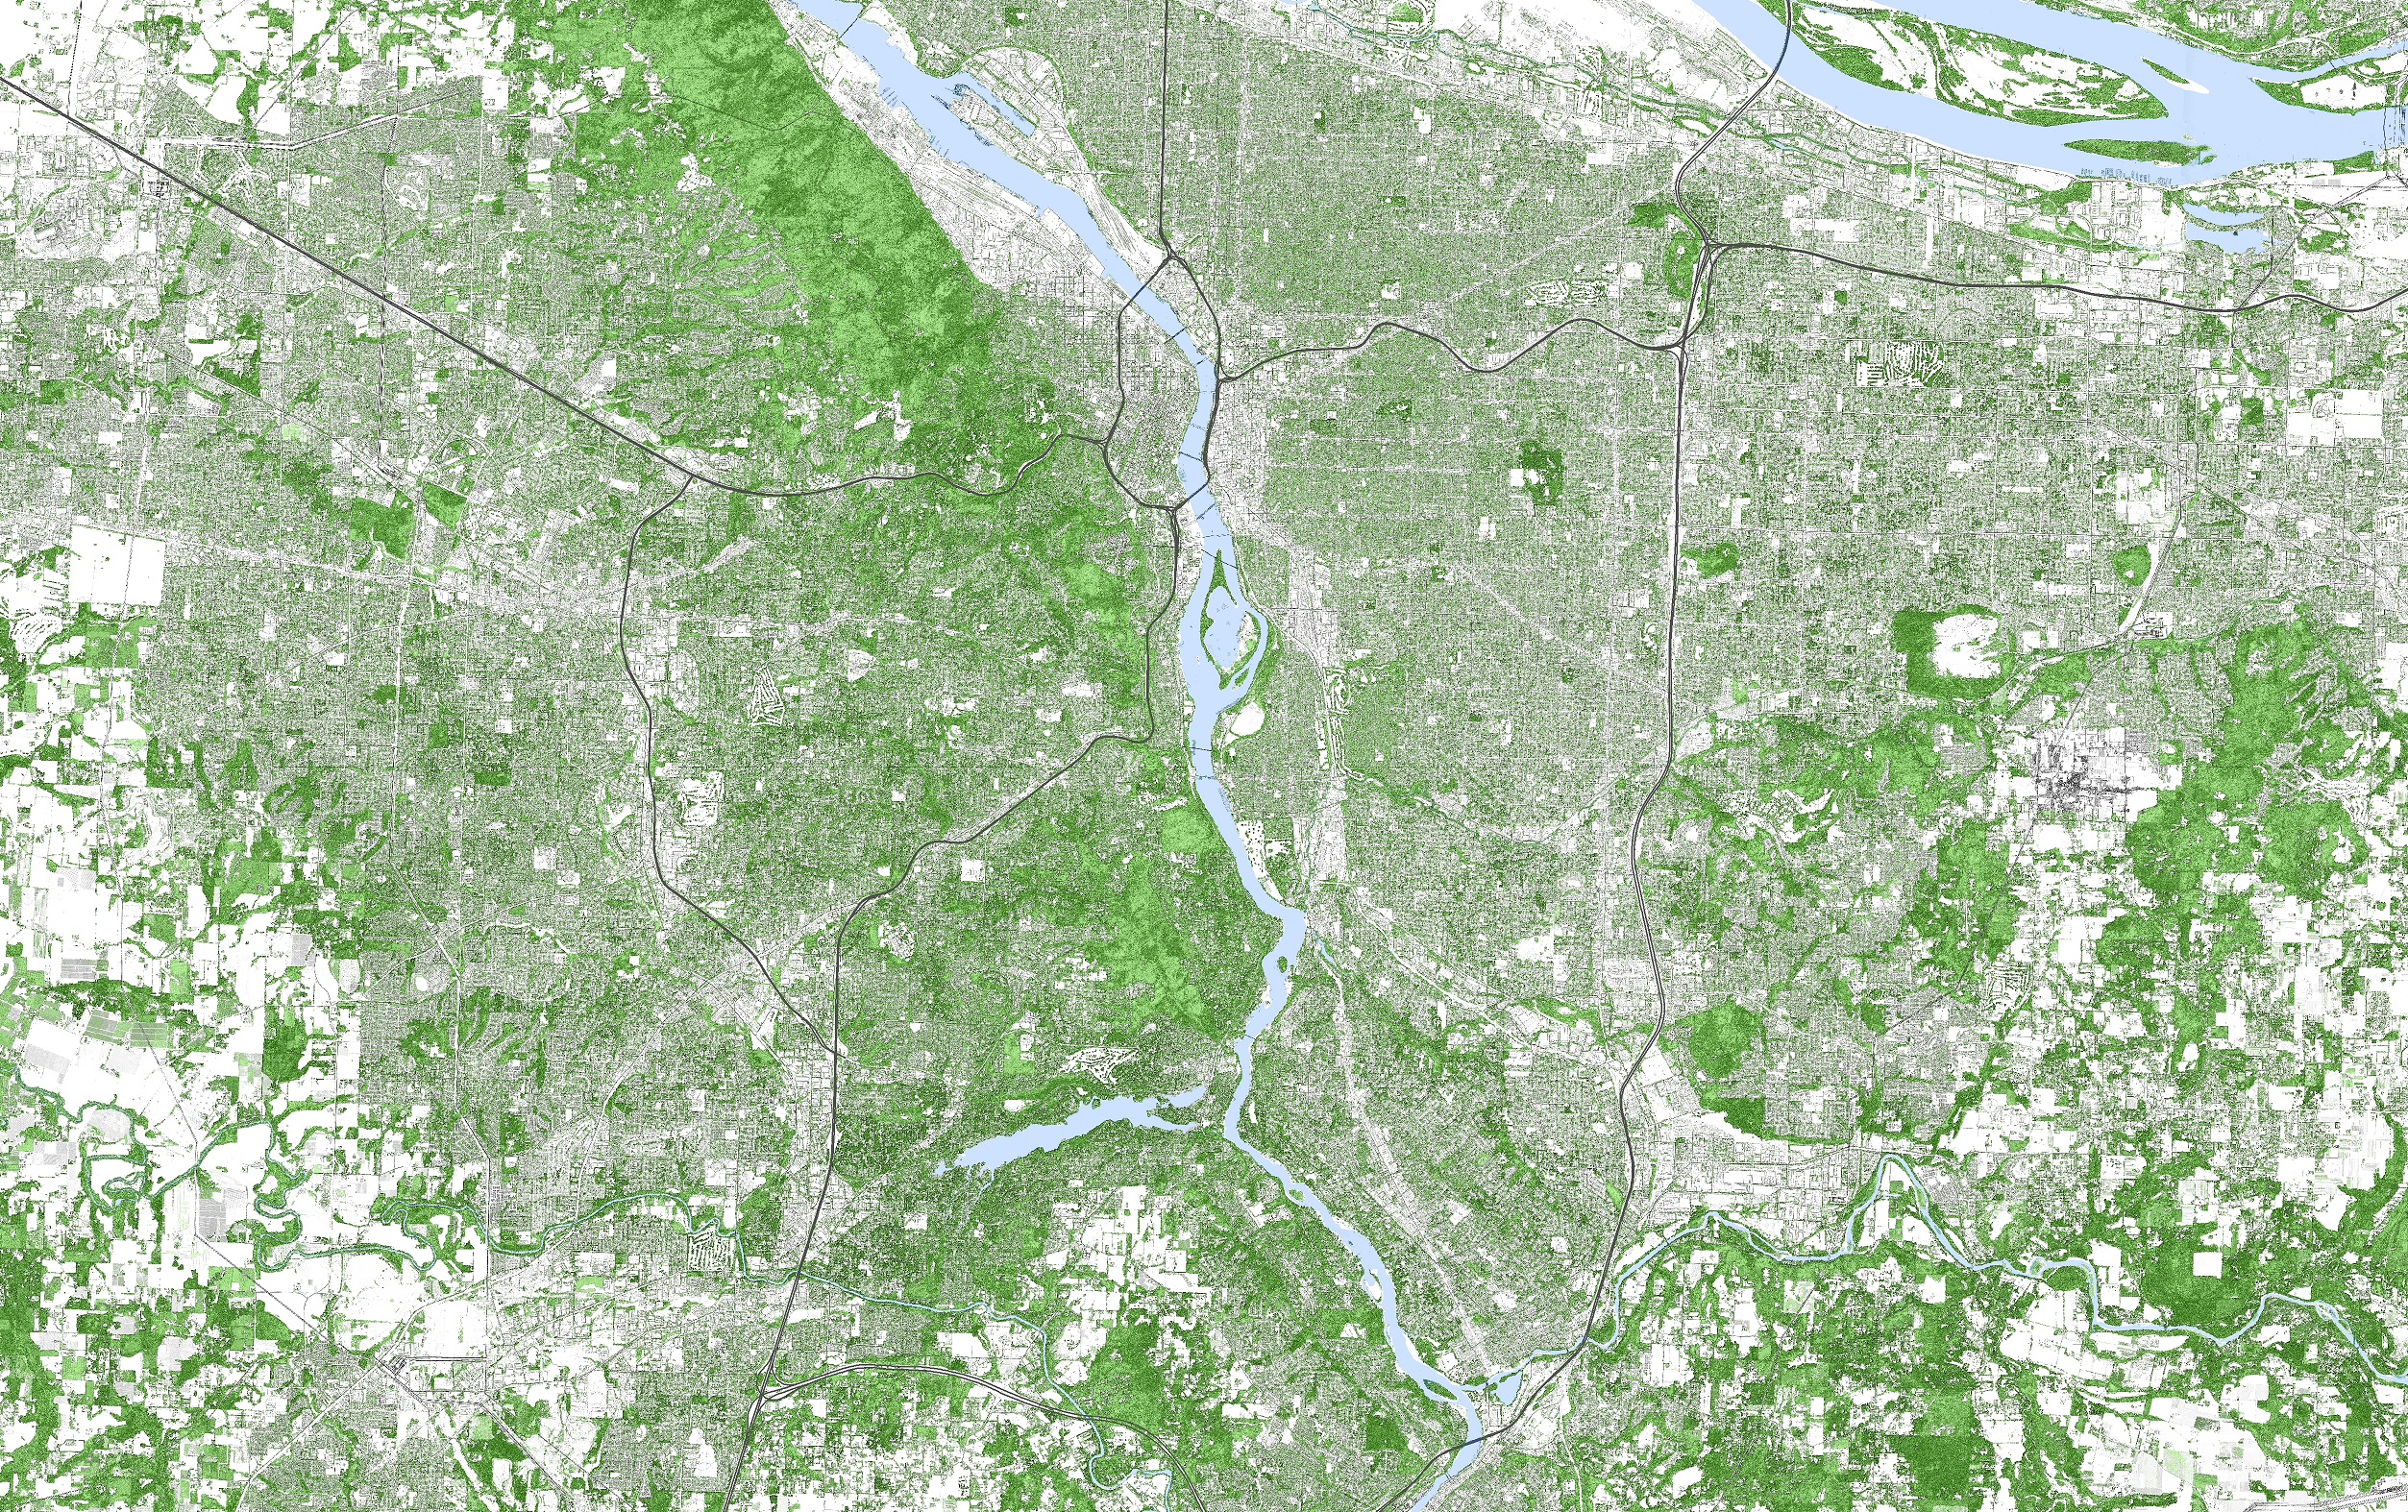
Green, Green, Green
Important questions:
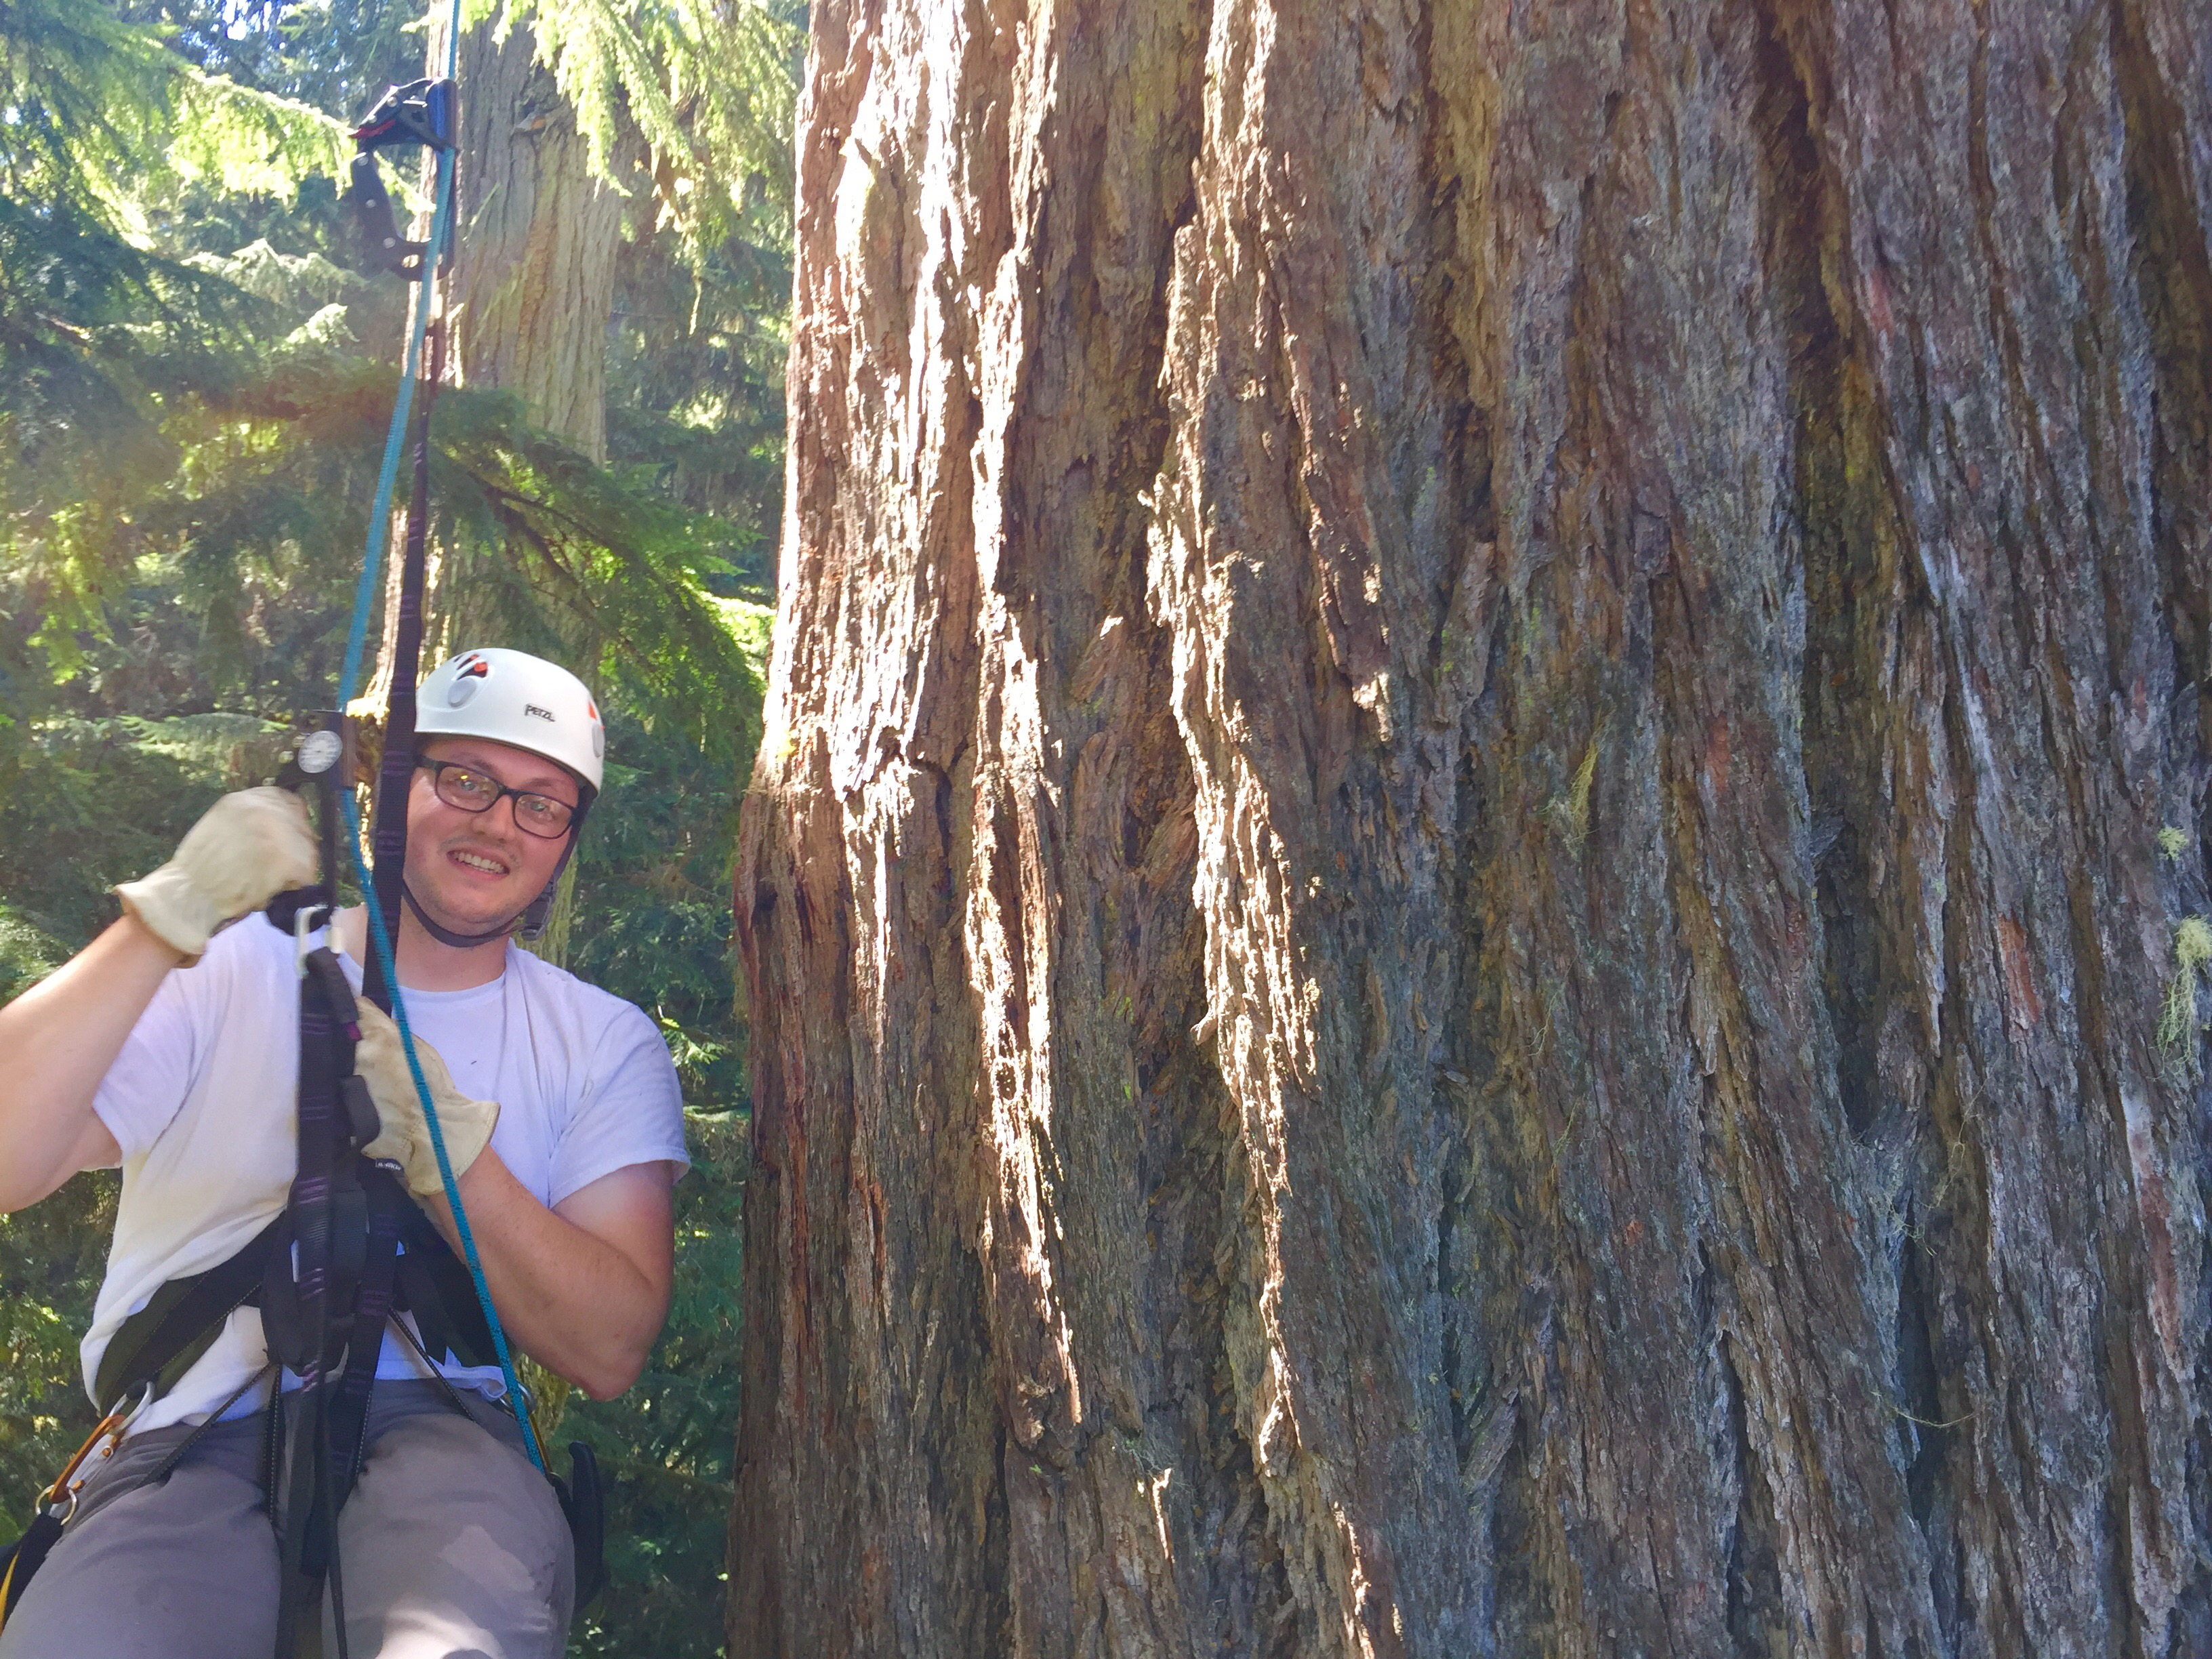
- How do we measure these trees?
- What trees are important (what is 'important', and to who)?
- How do we identify trees most in need of preservation?
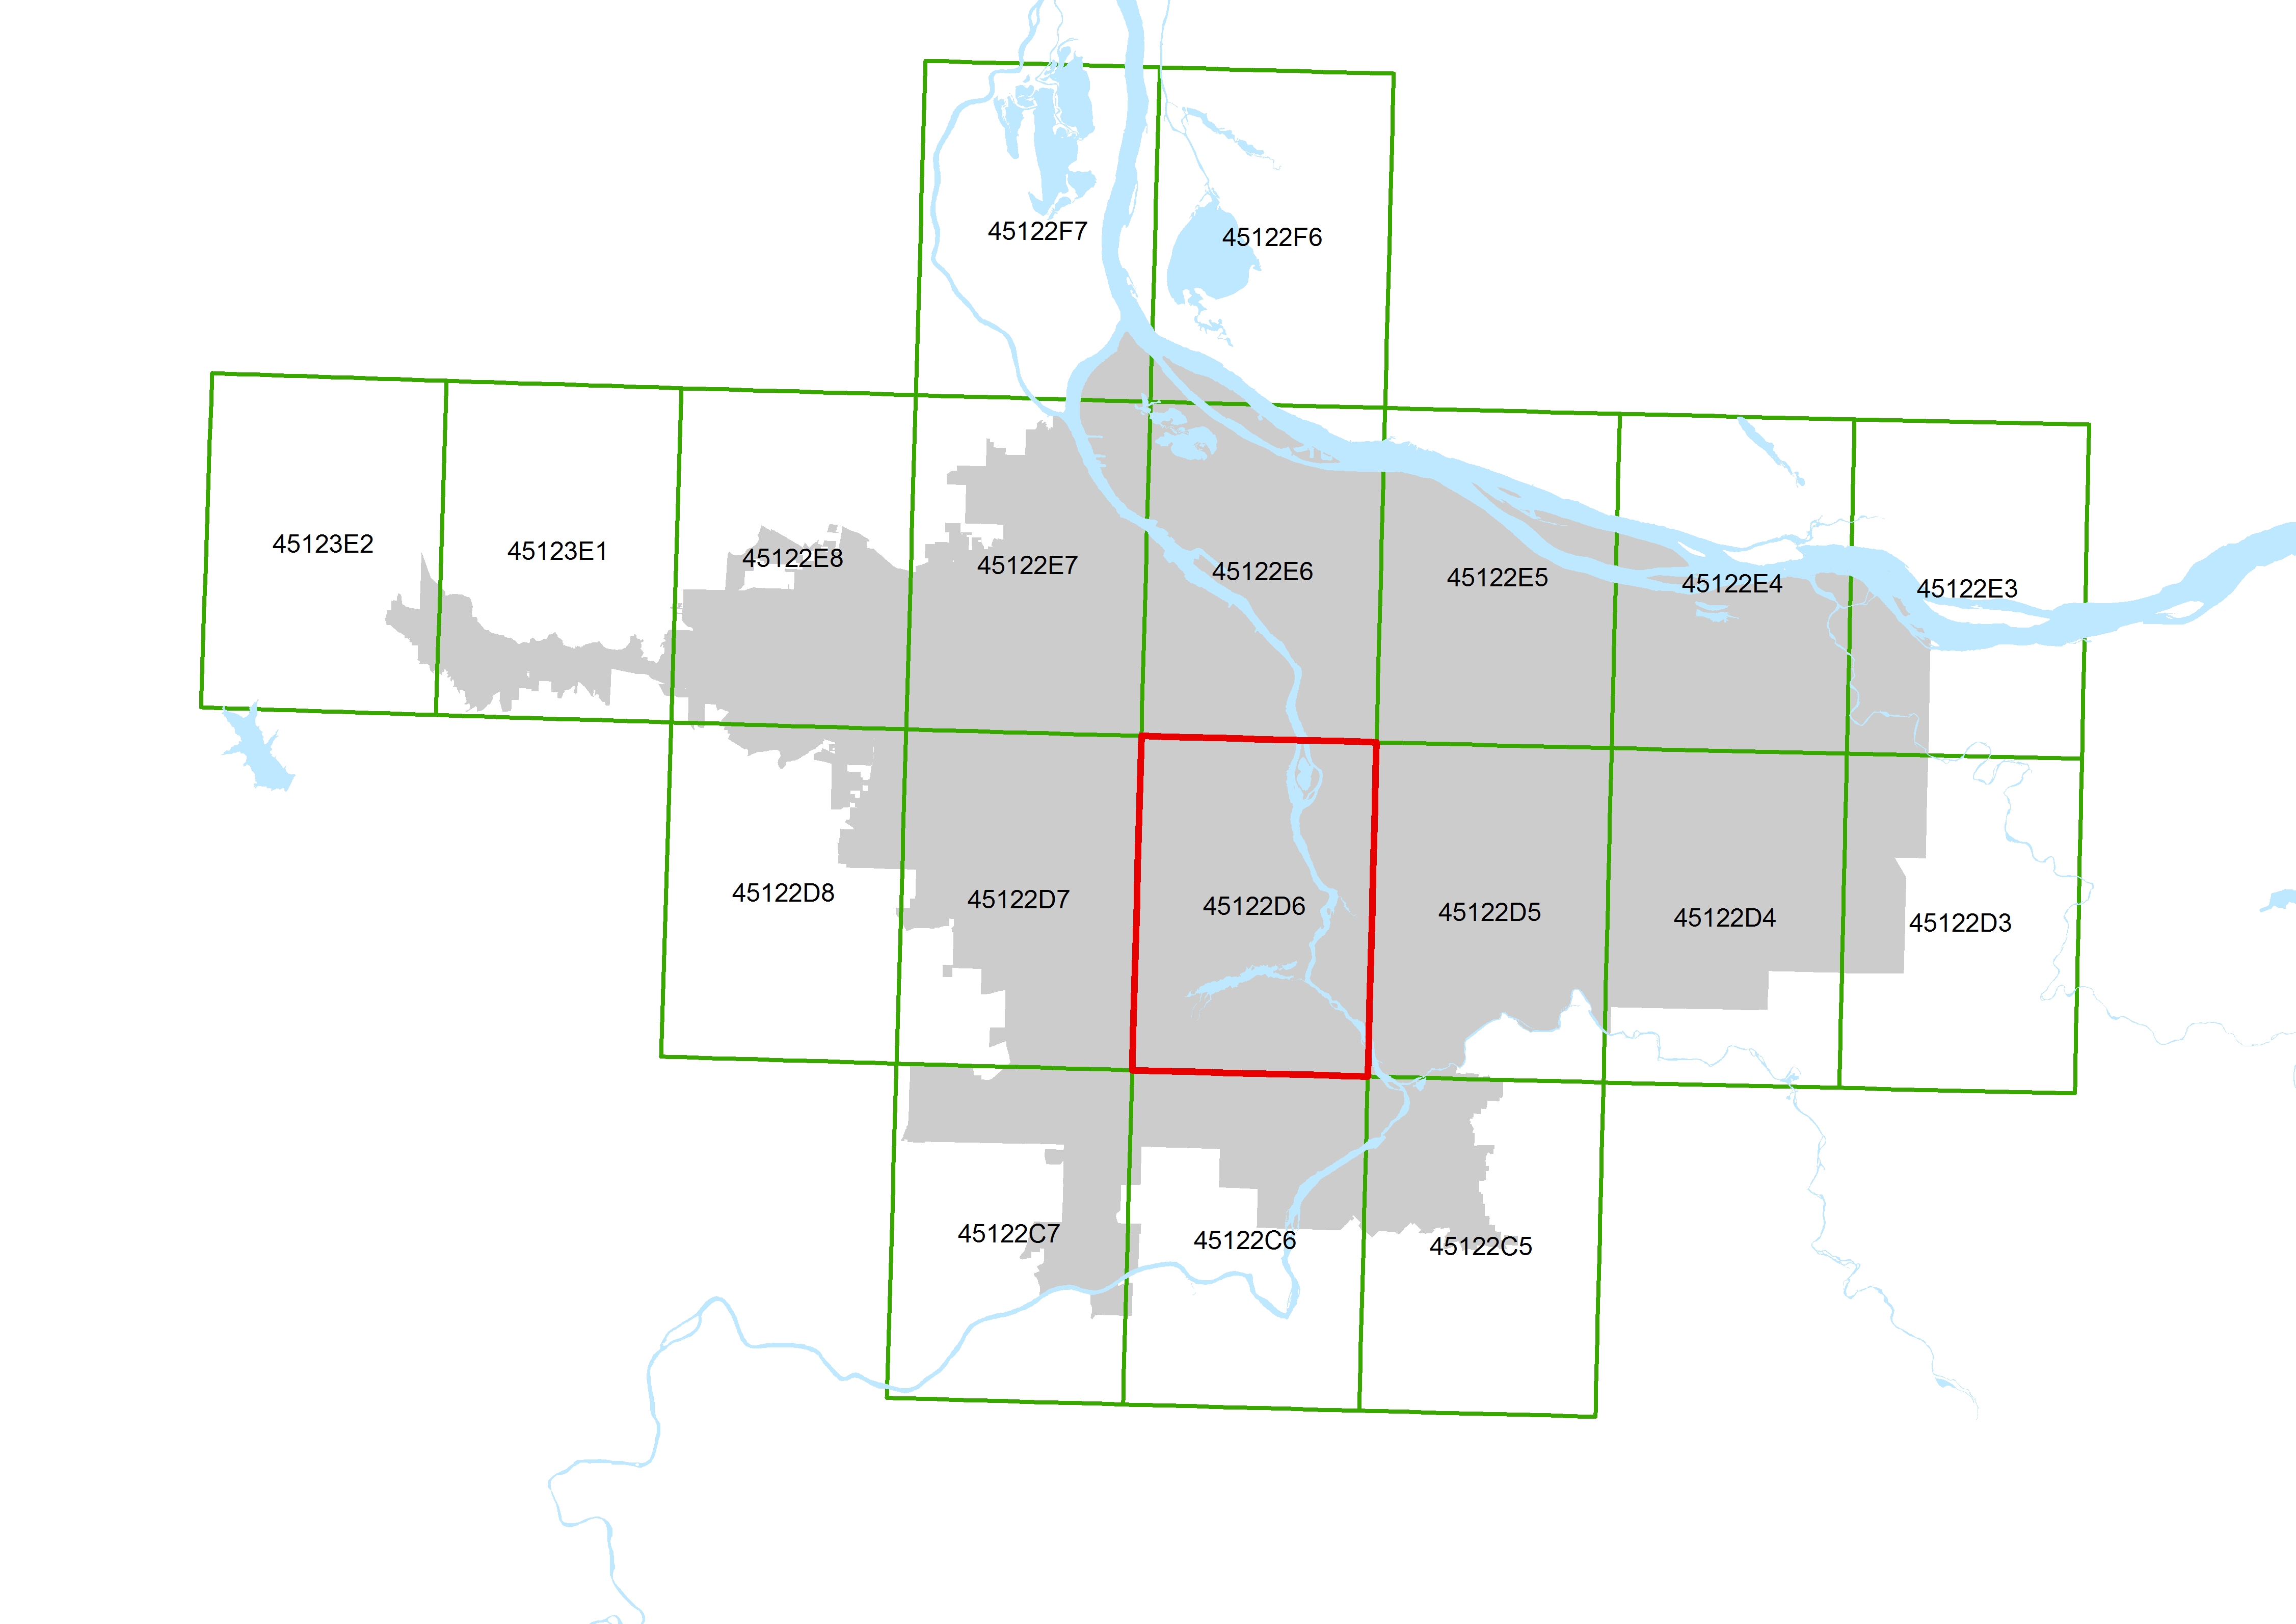
Data
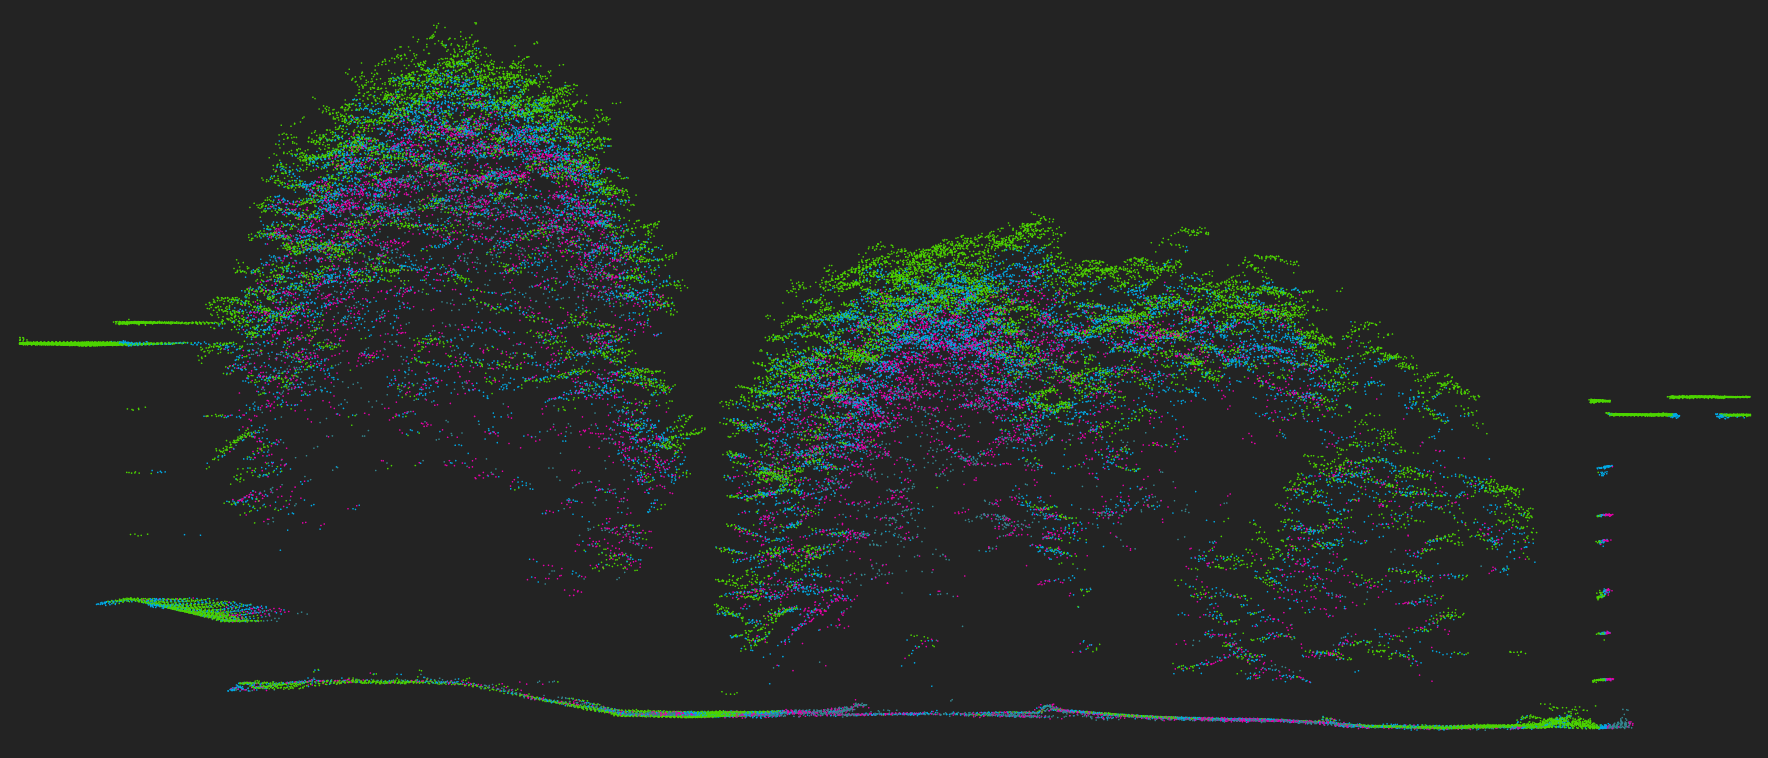
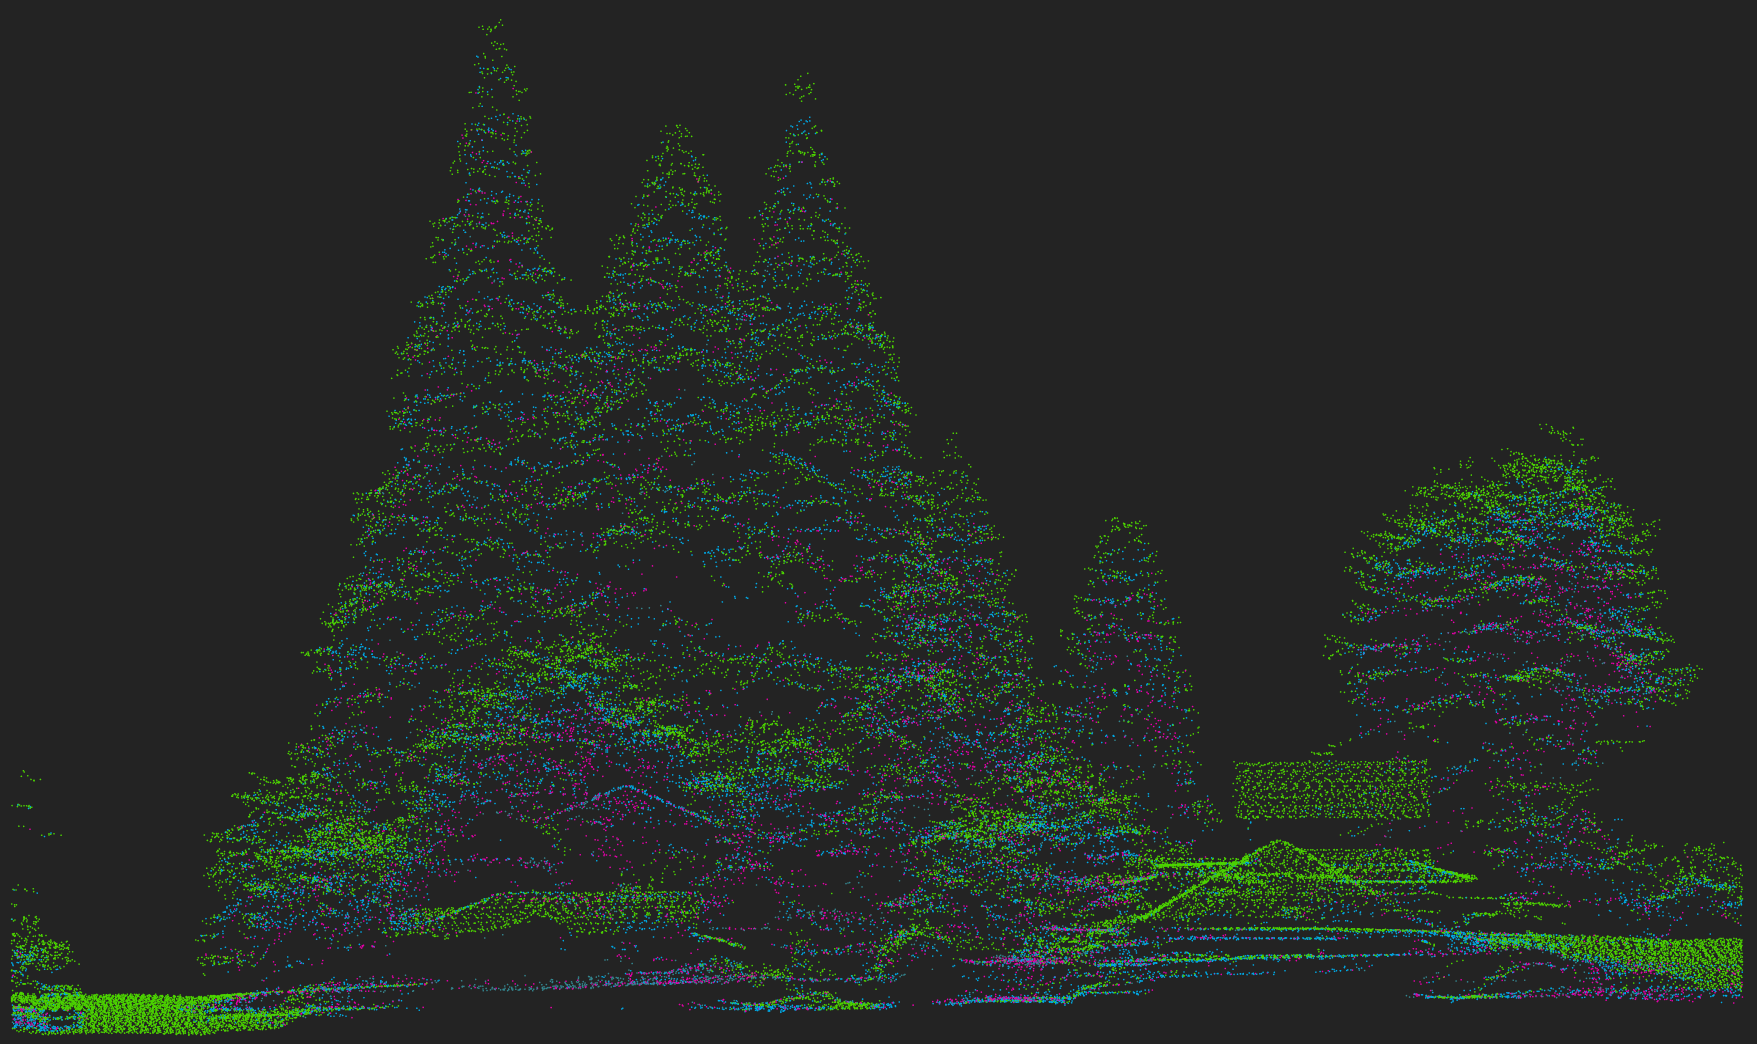
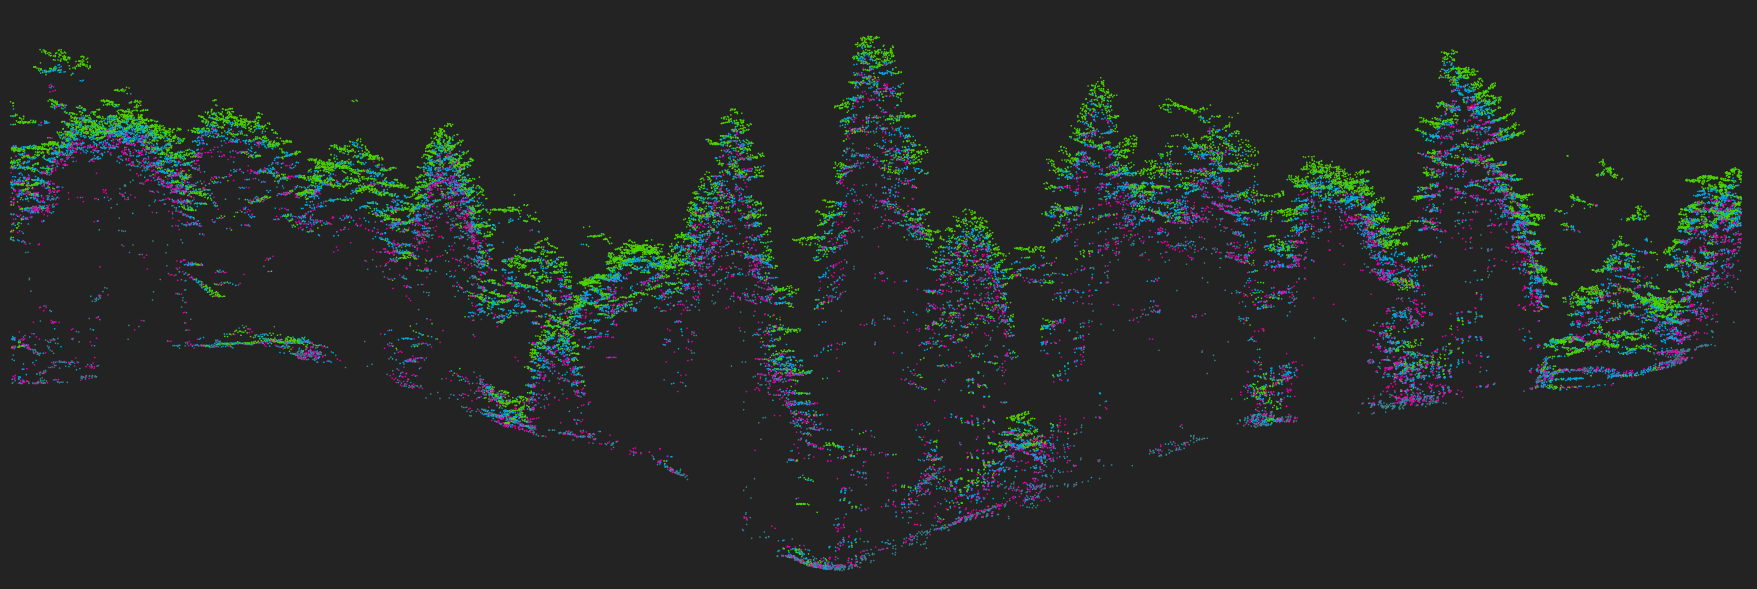
LiDAR
- Airborne Laser Scanning/Mapping
- ~12 points/m² on flat surface
- ~21cm point spacing
- ~63,600,000,000 (63.6 Billion) points in most recent flight

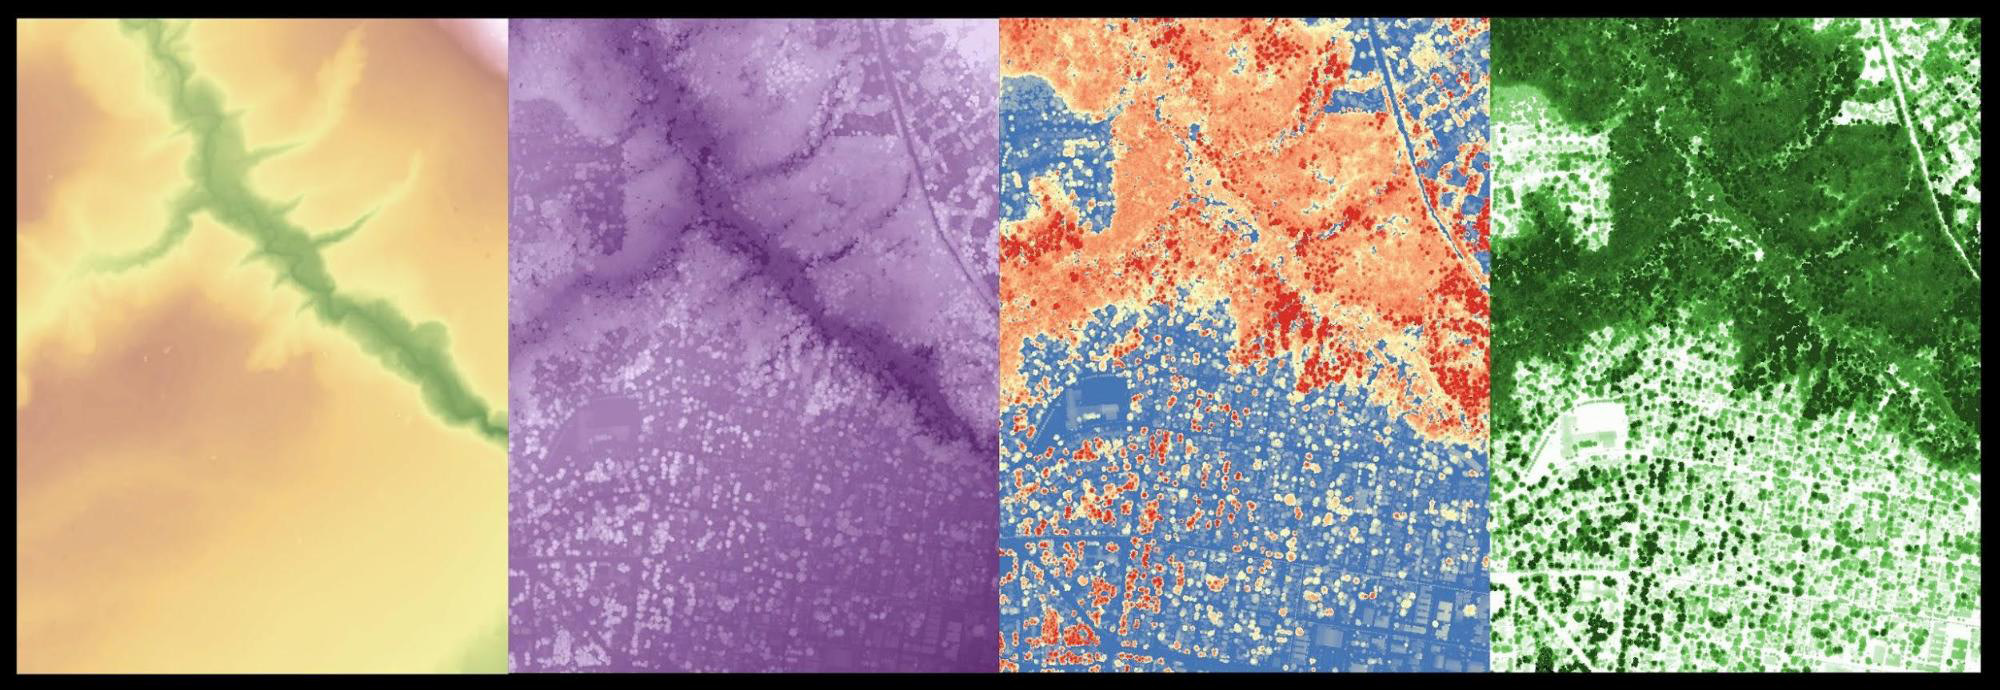
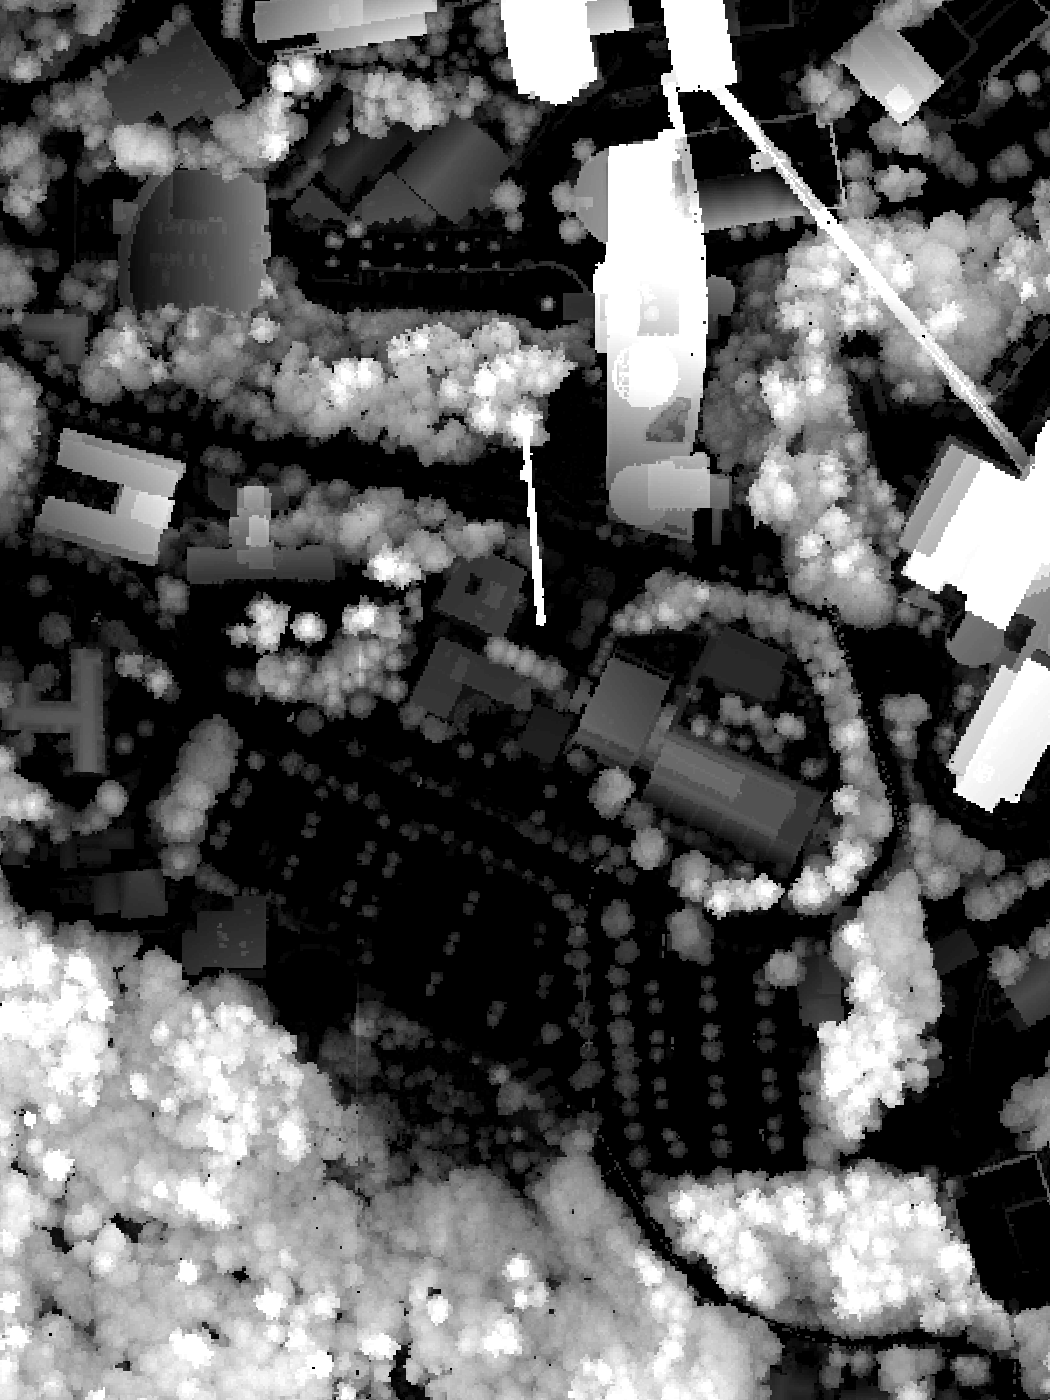
LiDAR Products
- Digital Elevation Model (DEM)
- Digital Surface Model (DSM)
- Digital Height Model (DHM)
- Canopy Density * Height (CDM or "Biomass")

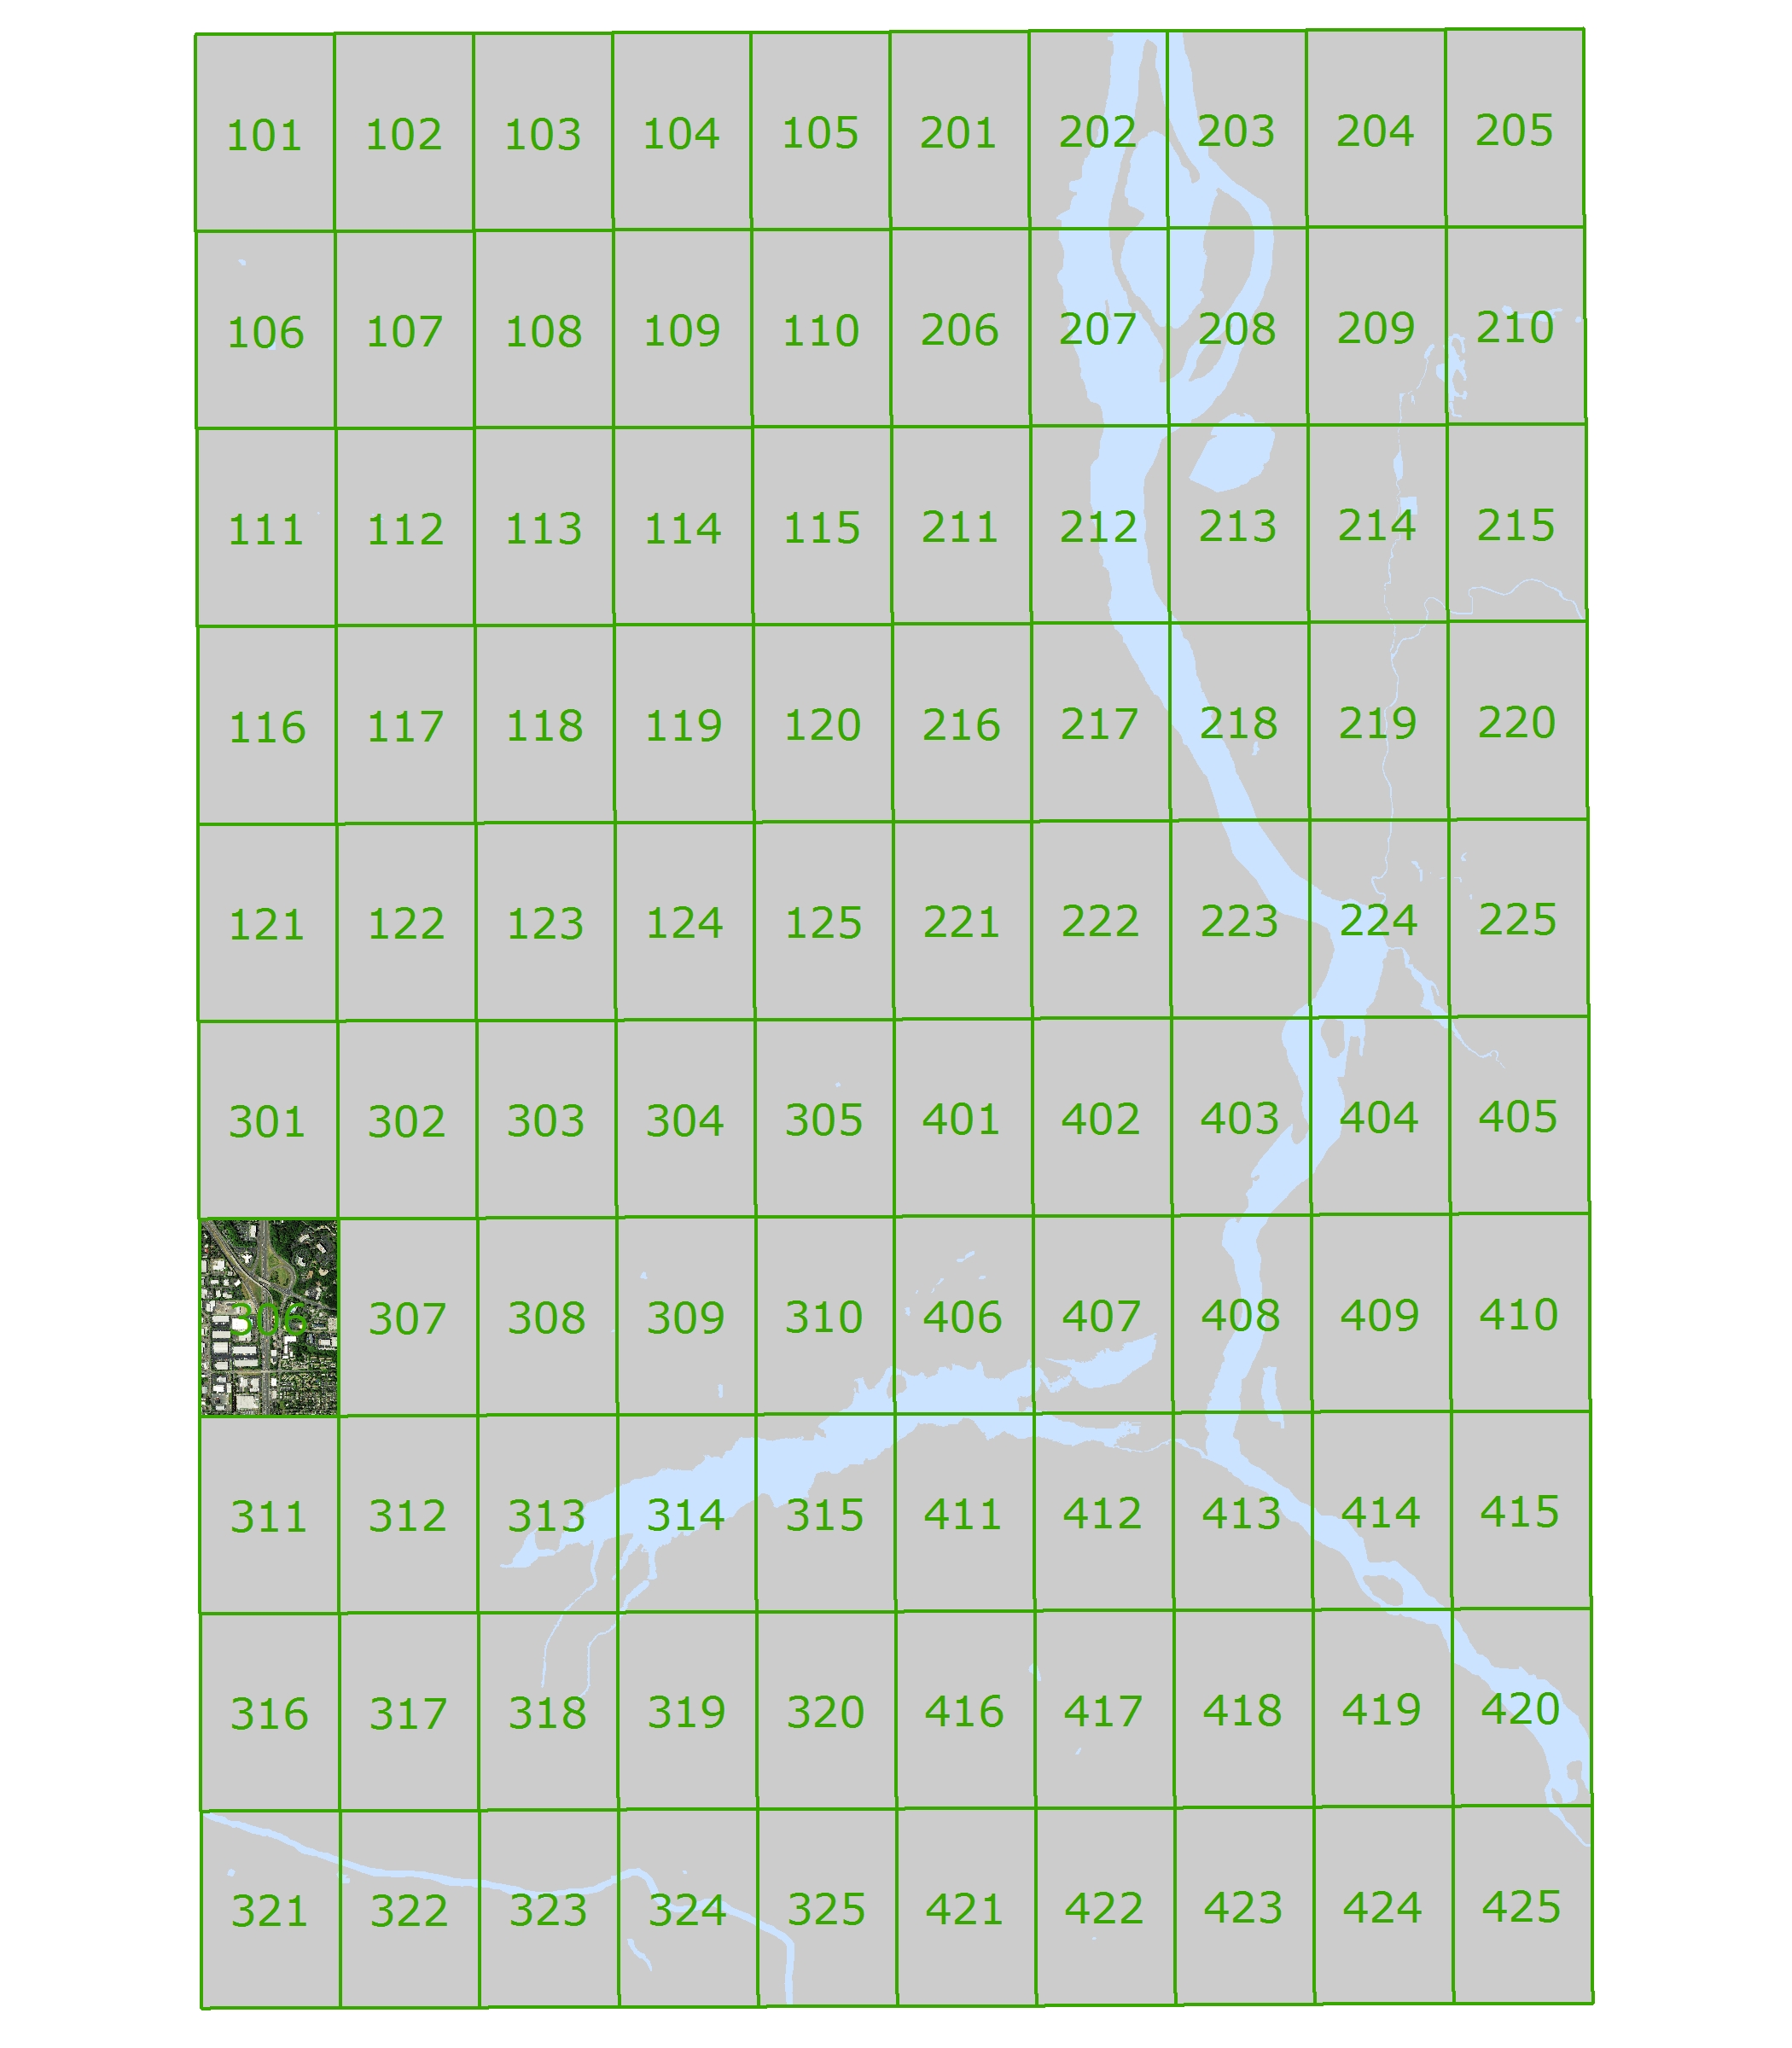
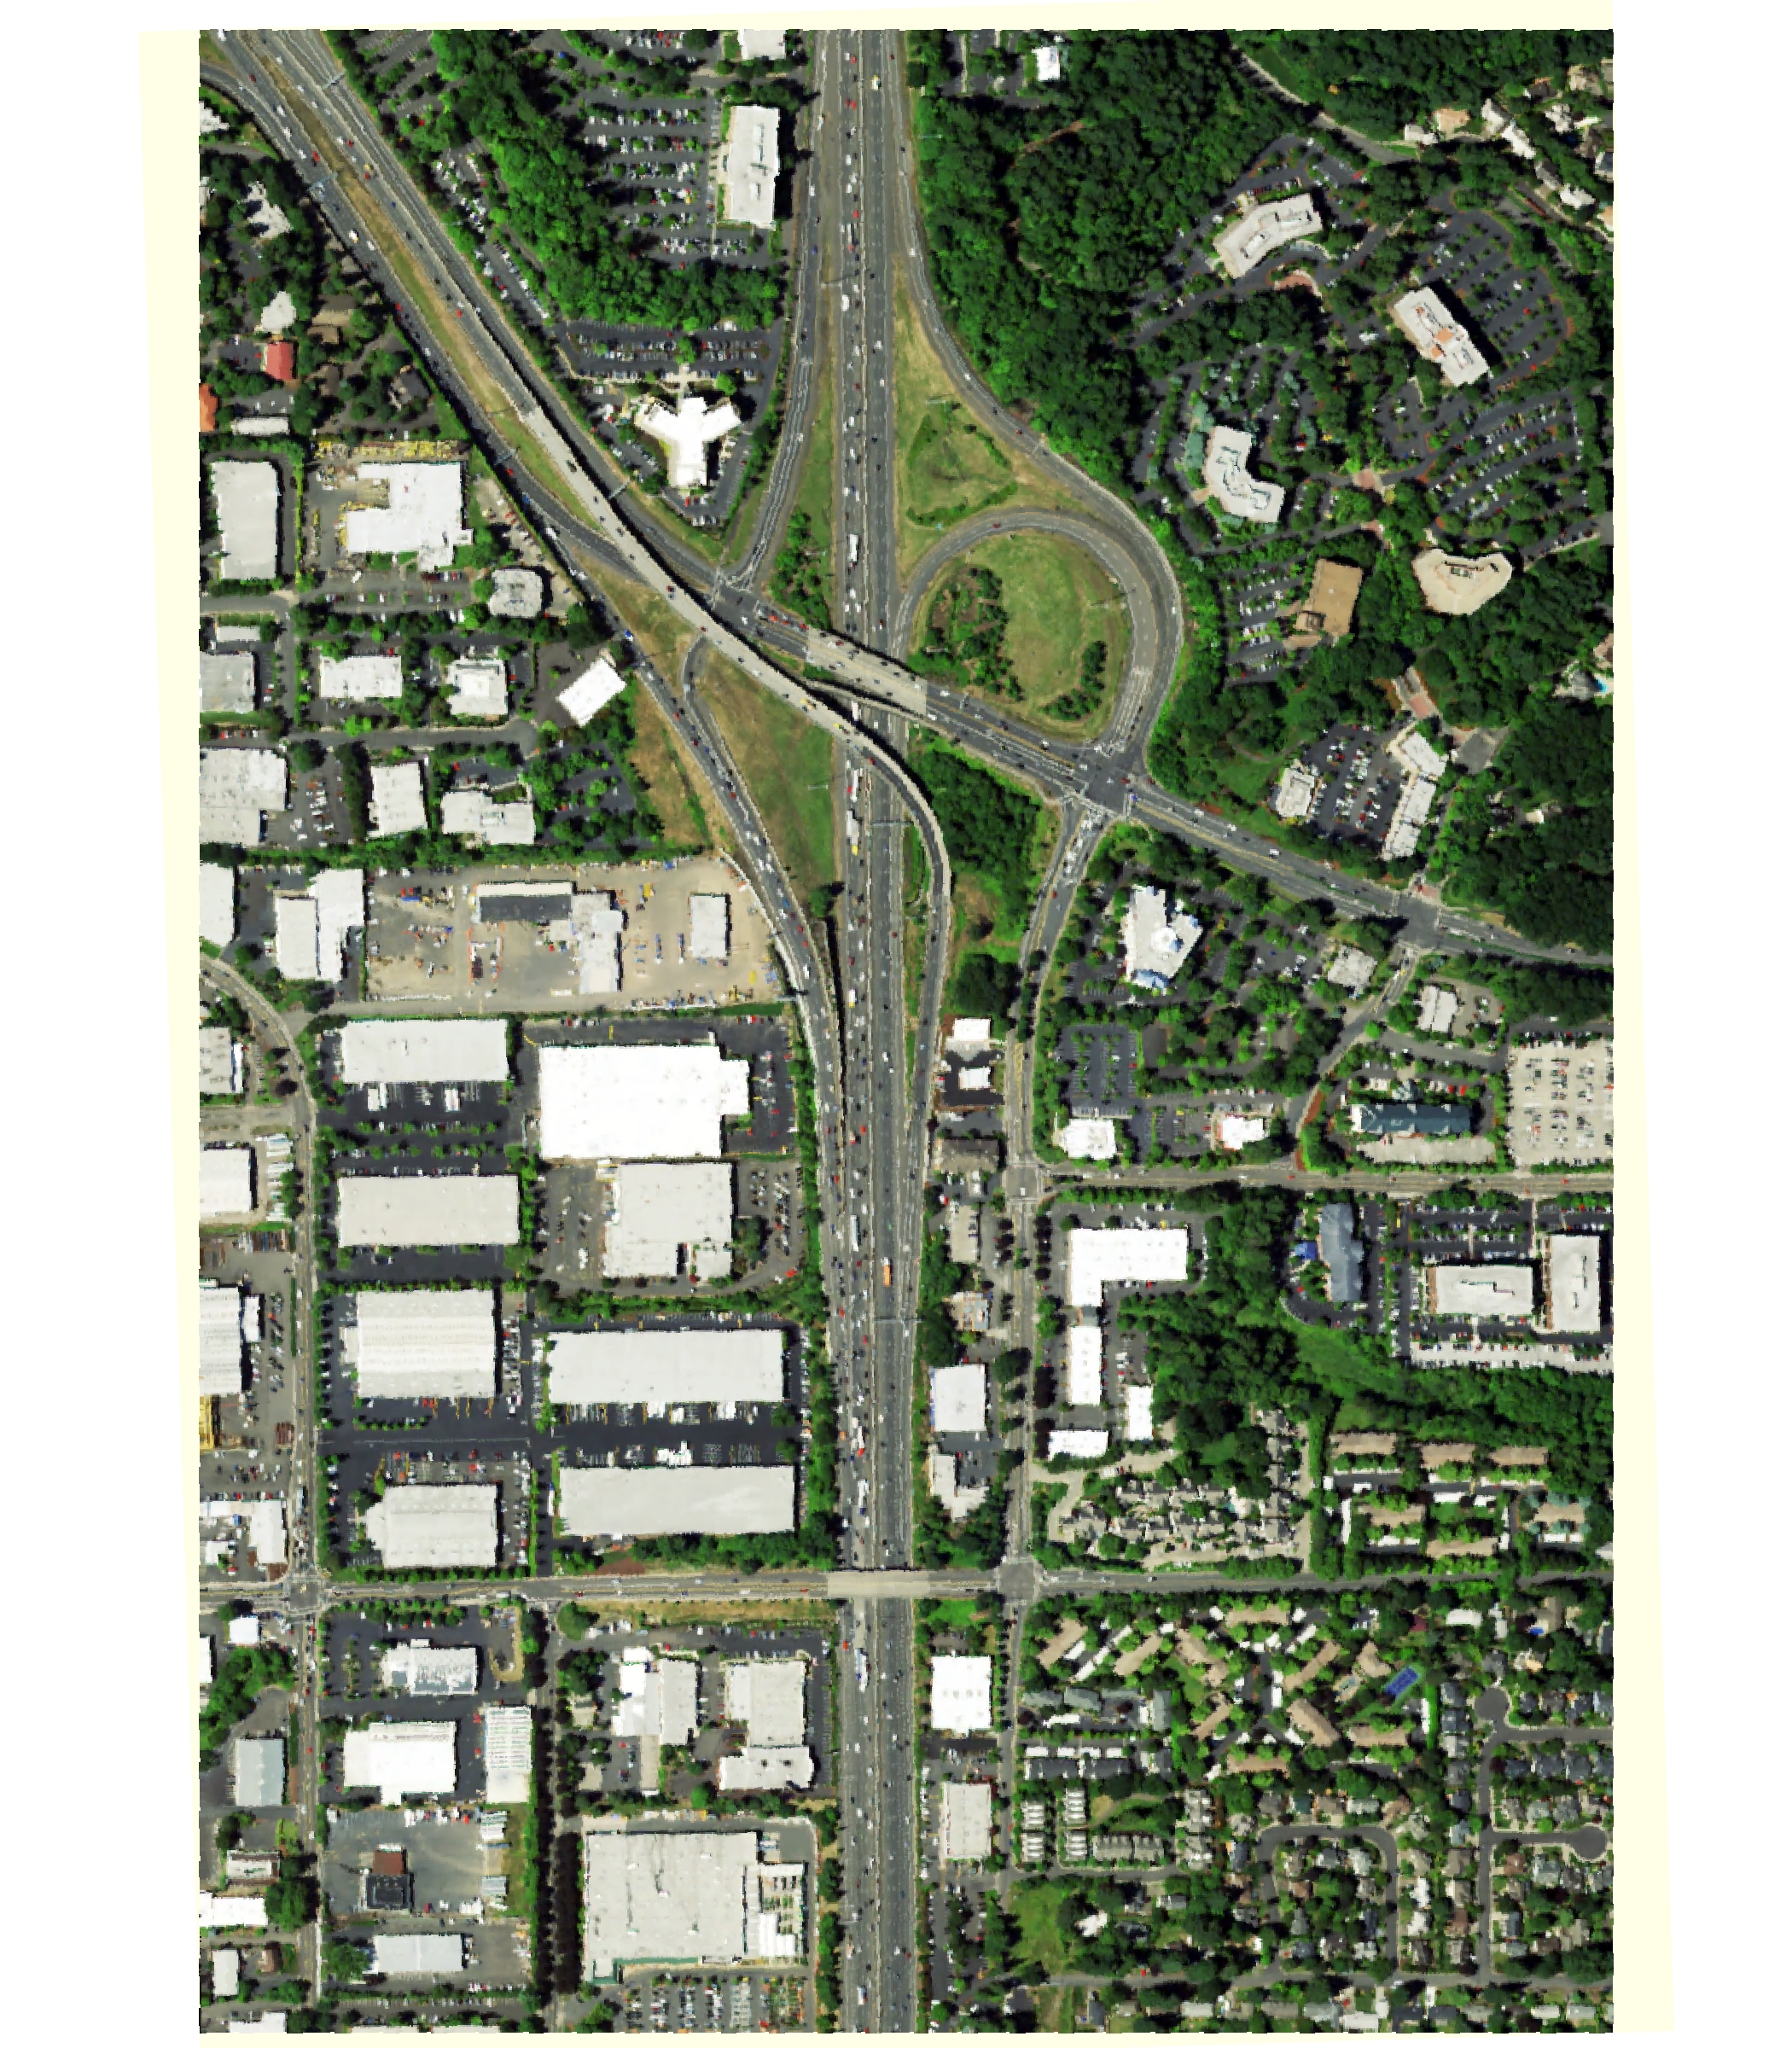
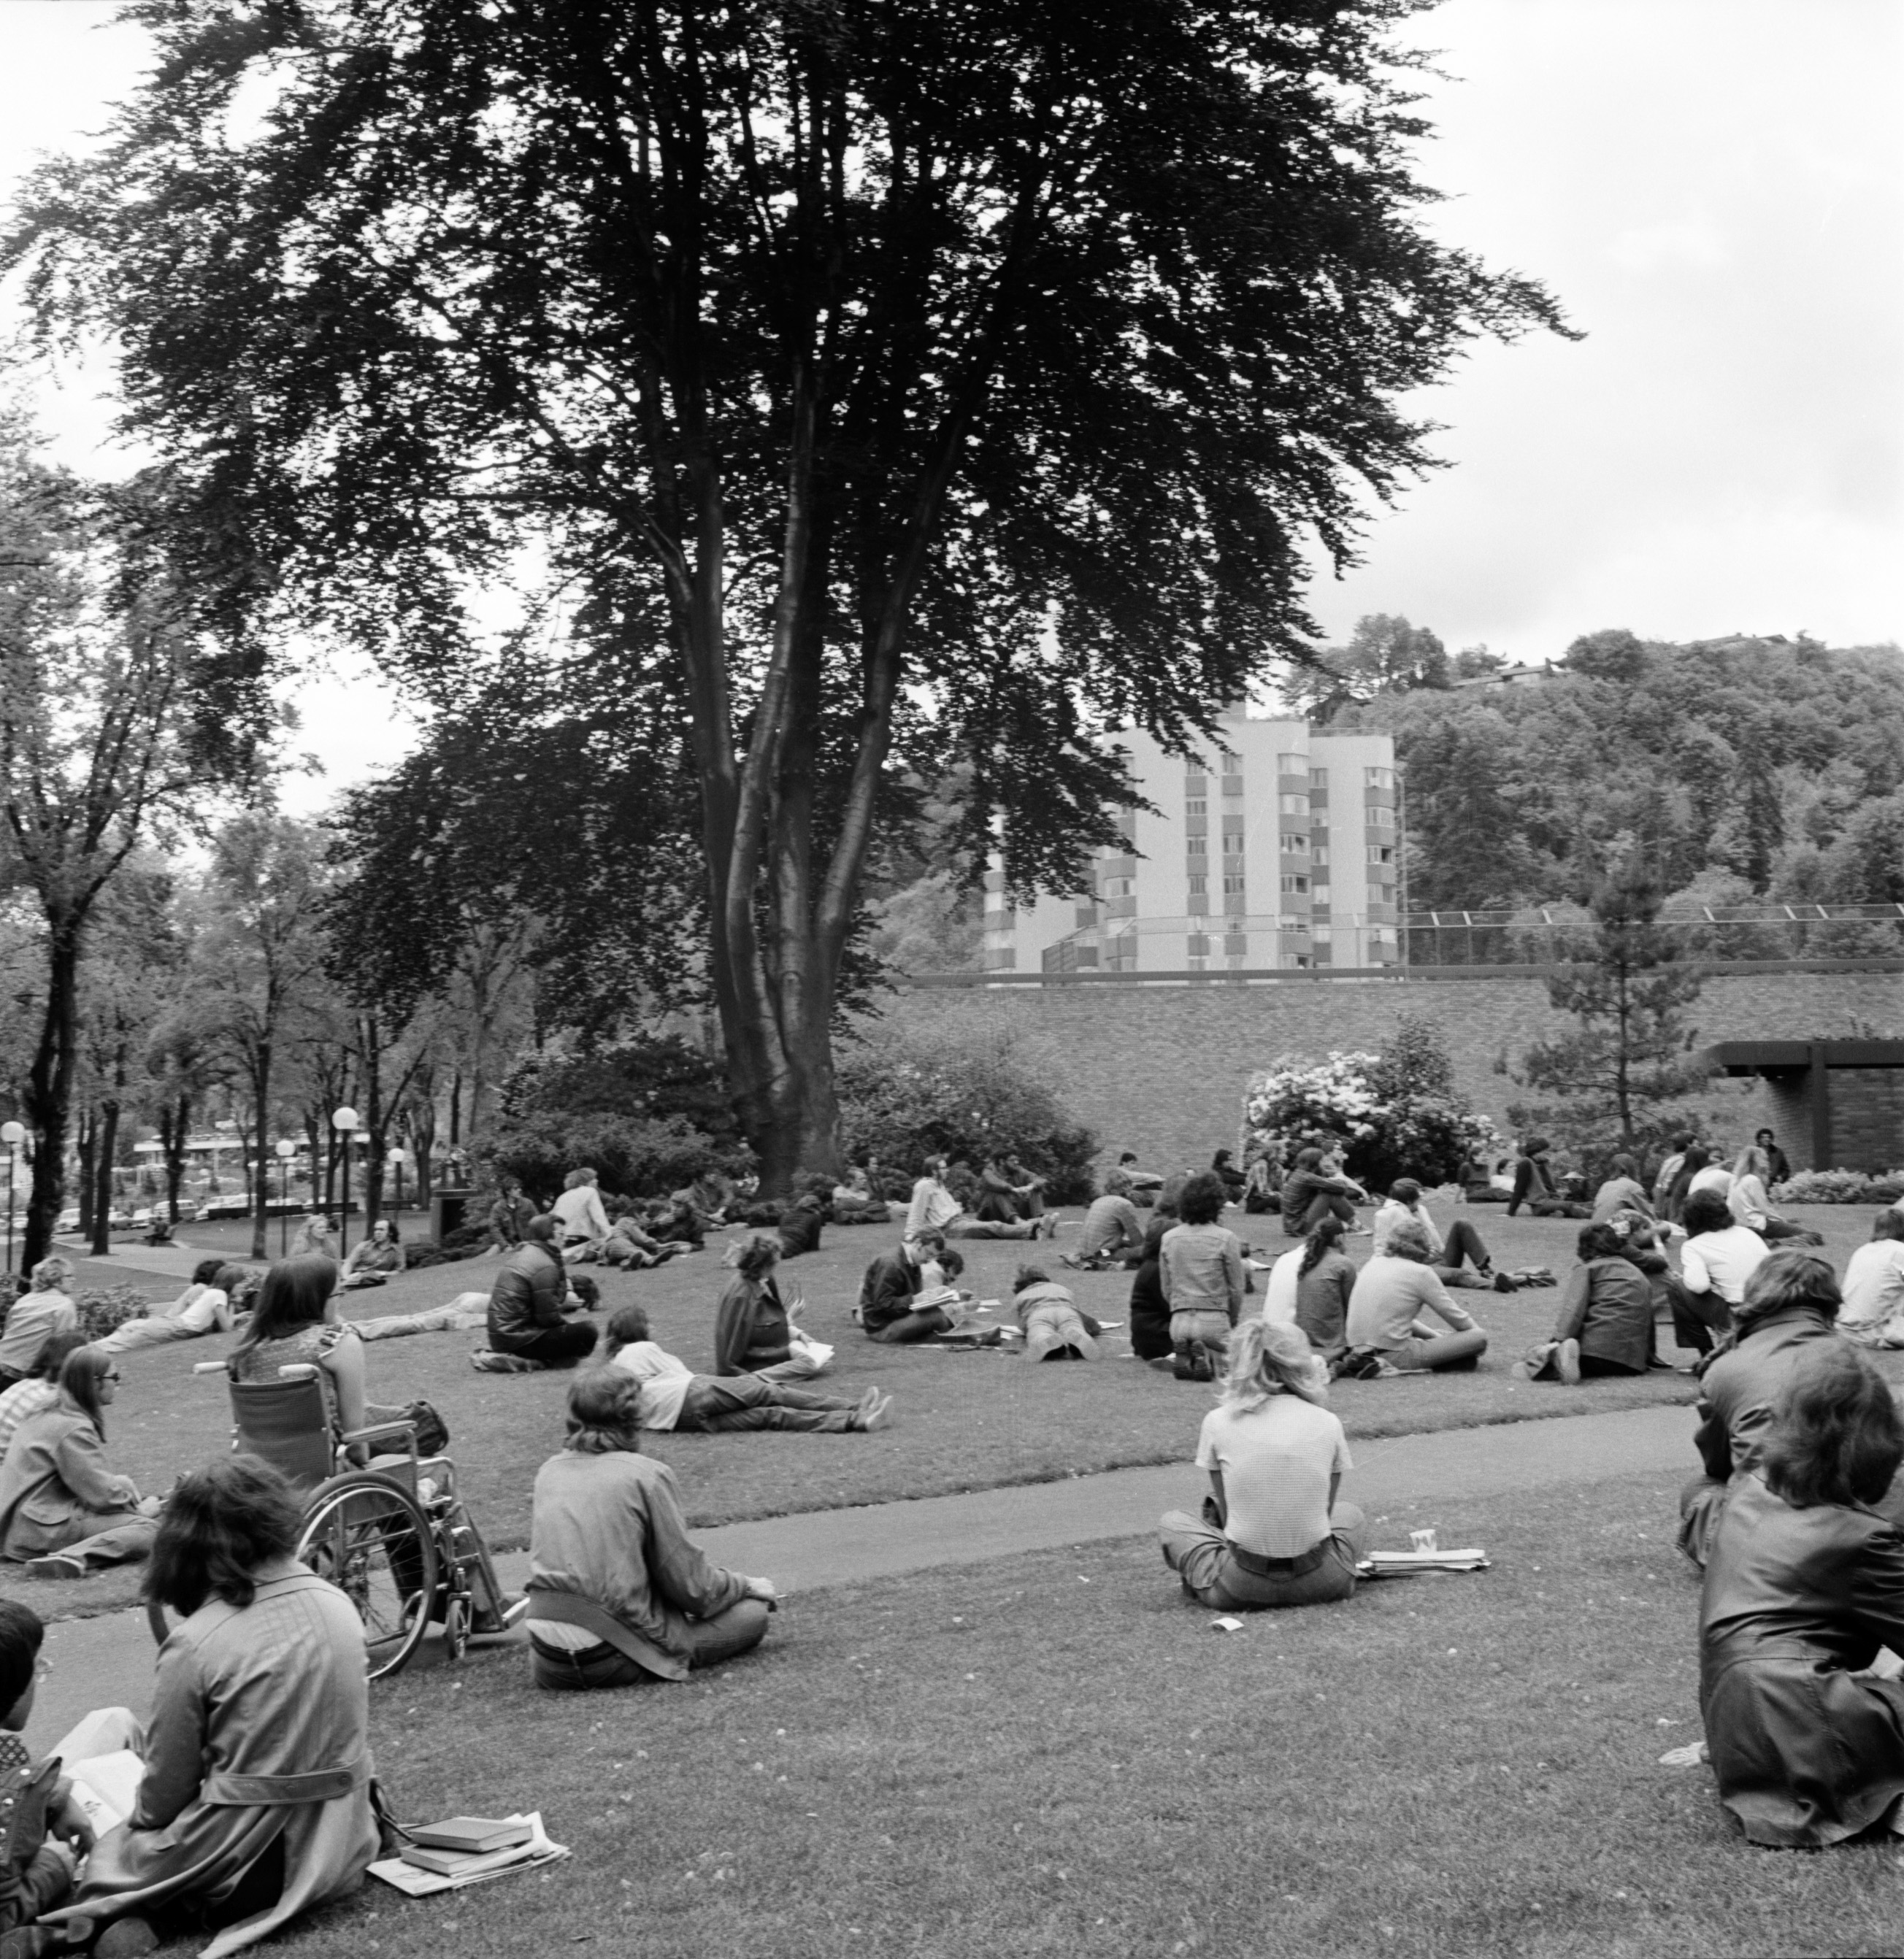
Exploring the Urban Forest
The Tallest Tree in Portland
N Williams
Powell Butte
Oswego Lake

Portland State University
Portland State University
Portland State University

Portland State University
Eastmoreland Sequoias
Arnold Creek
Forest Park / Linnton
The Grove
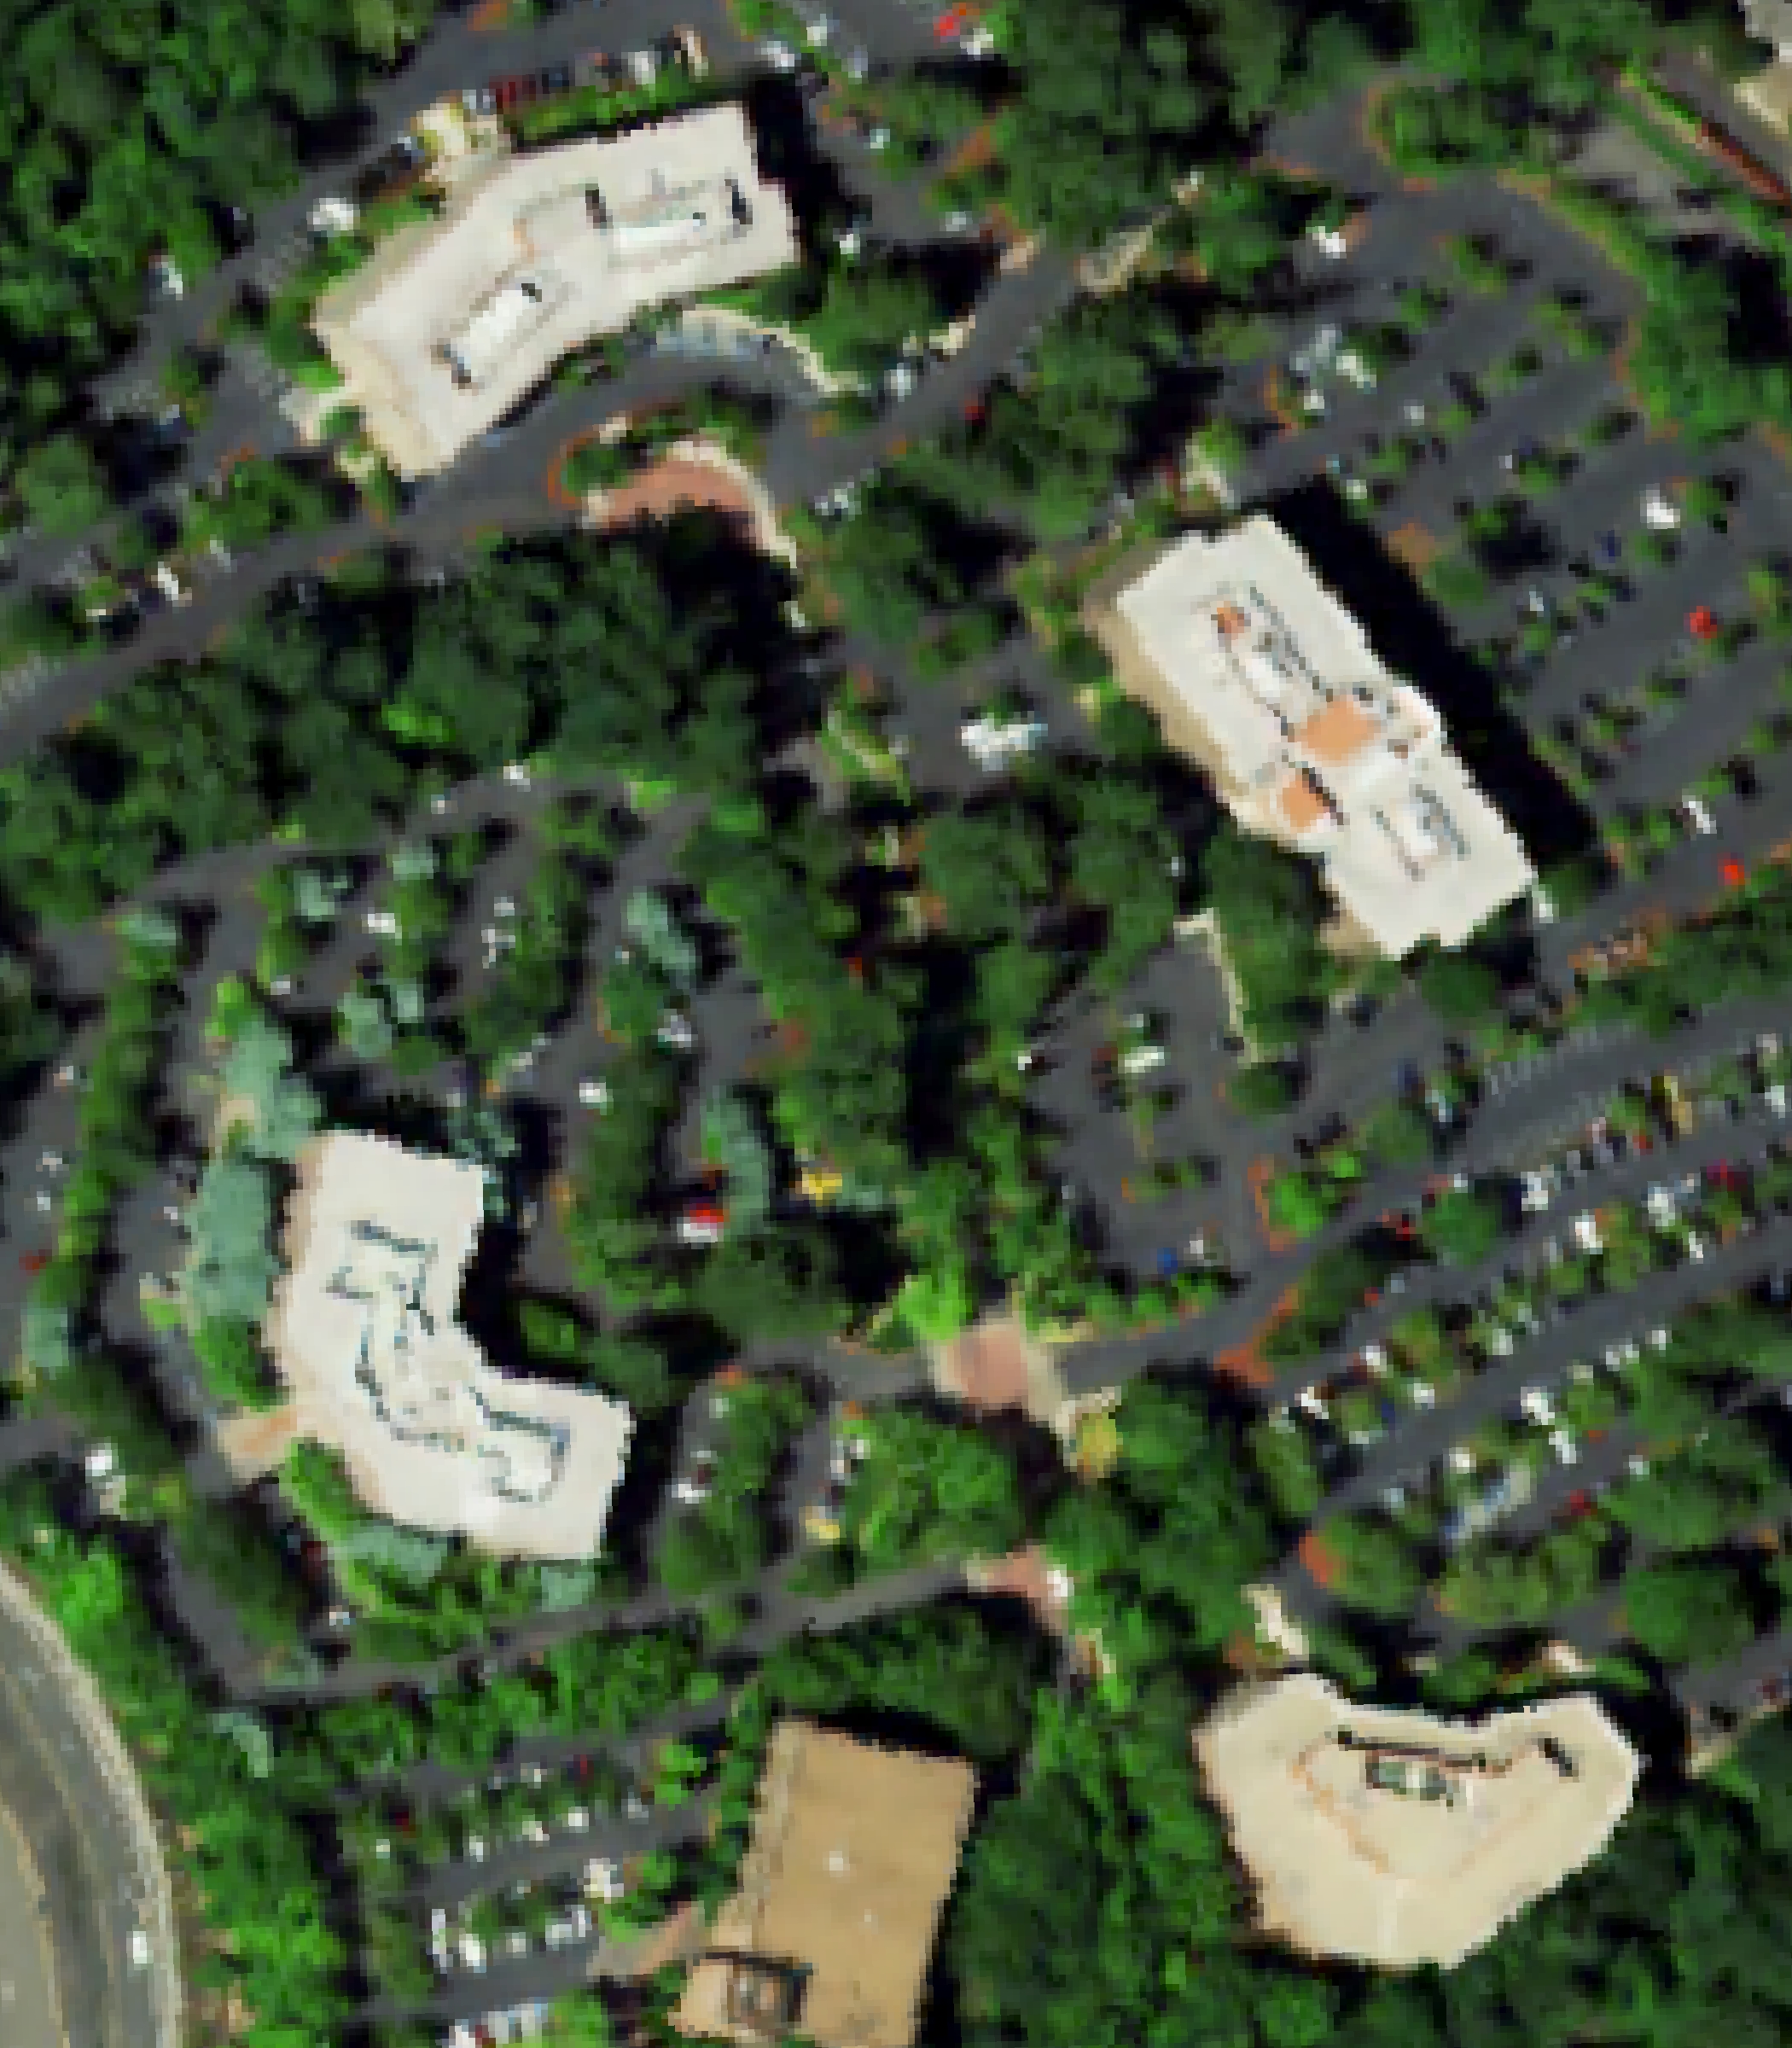
What about every tree?
Steps:
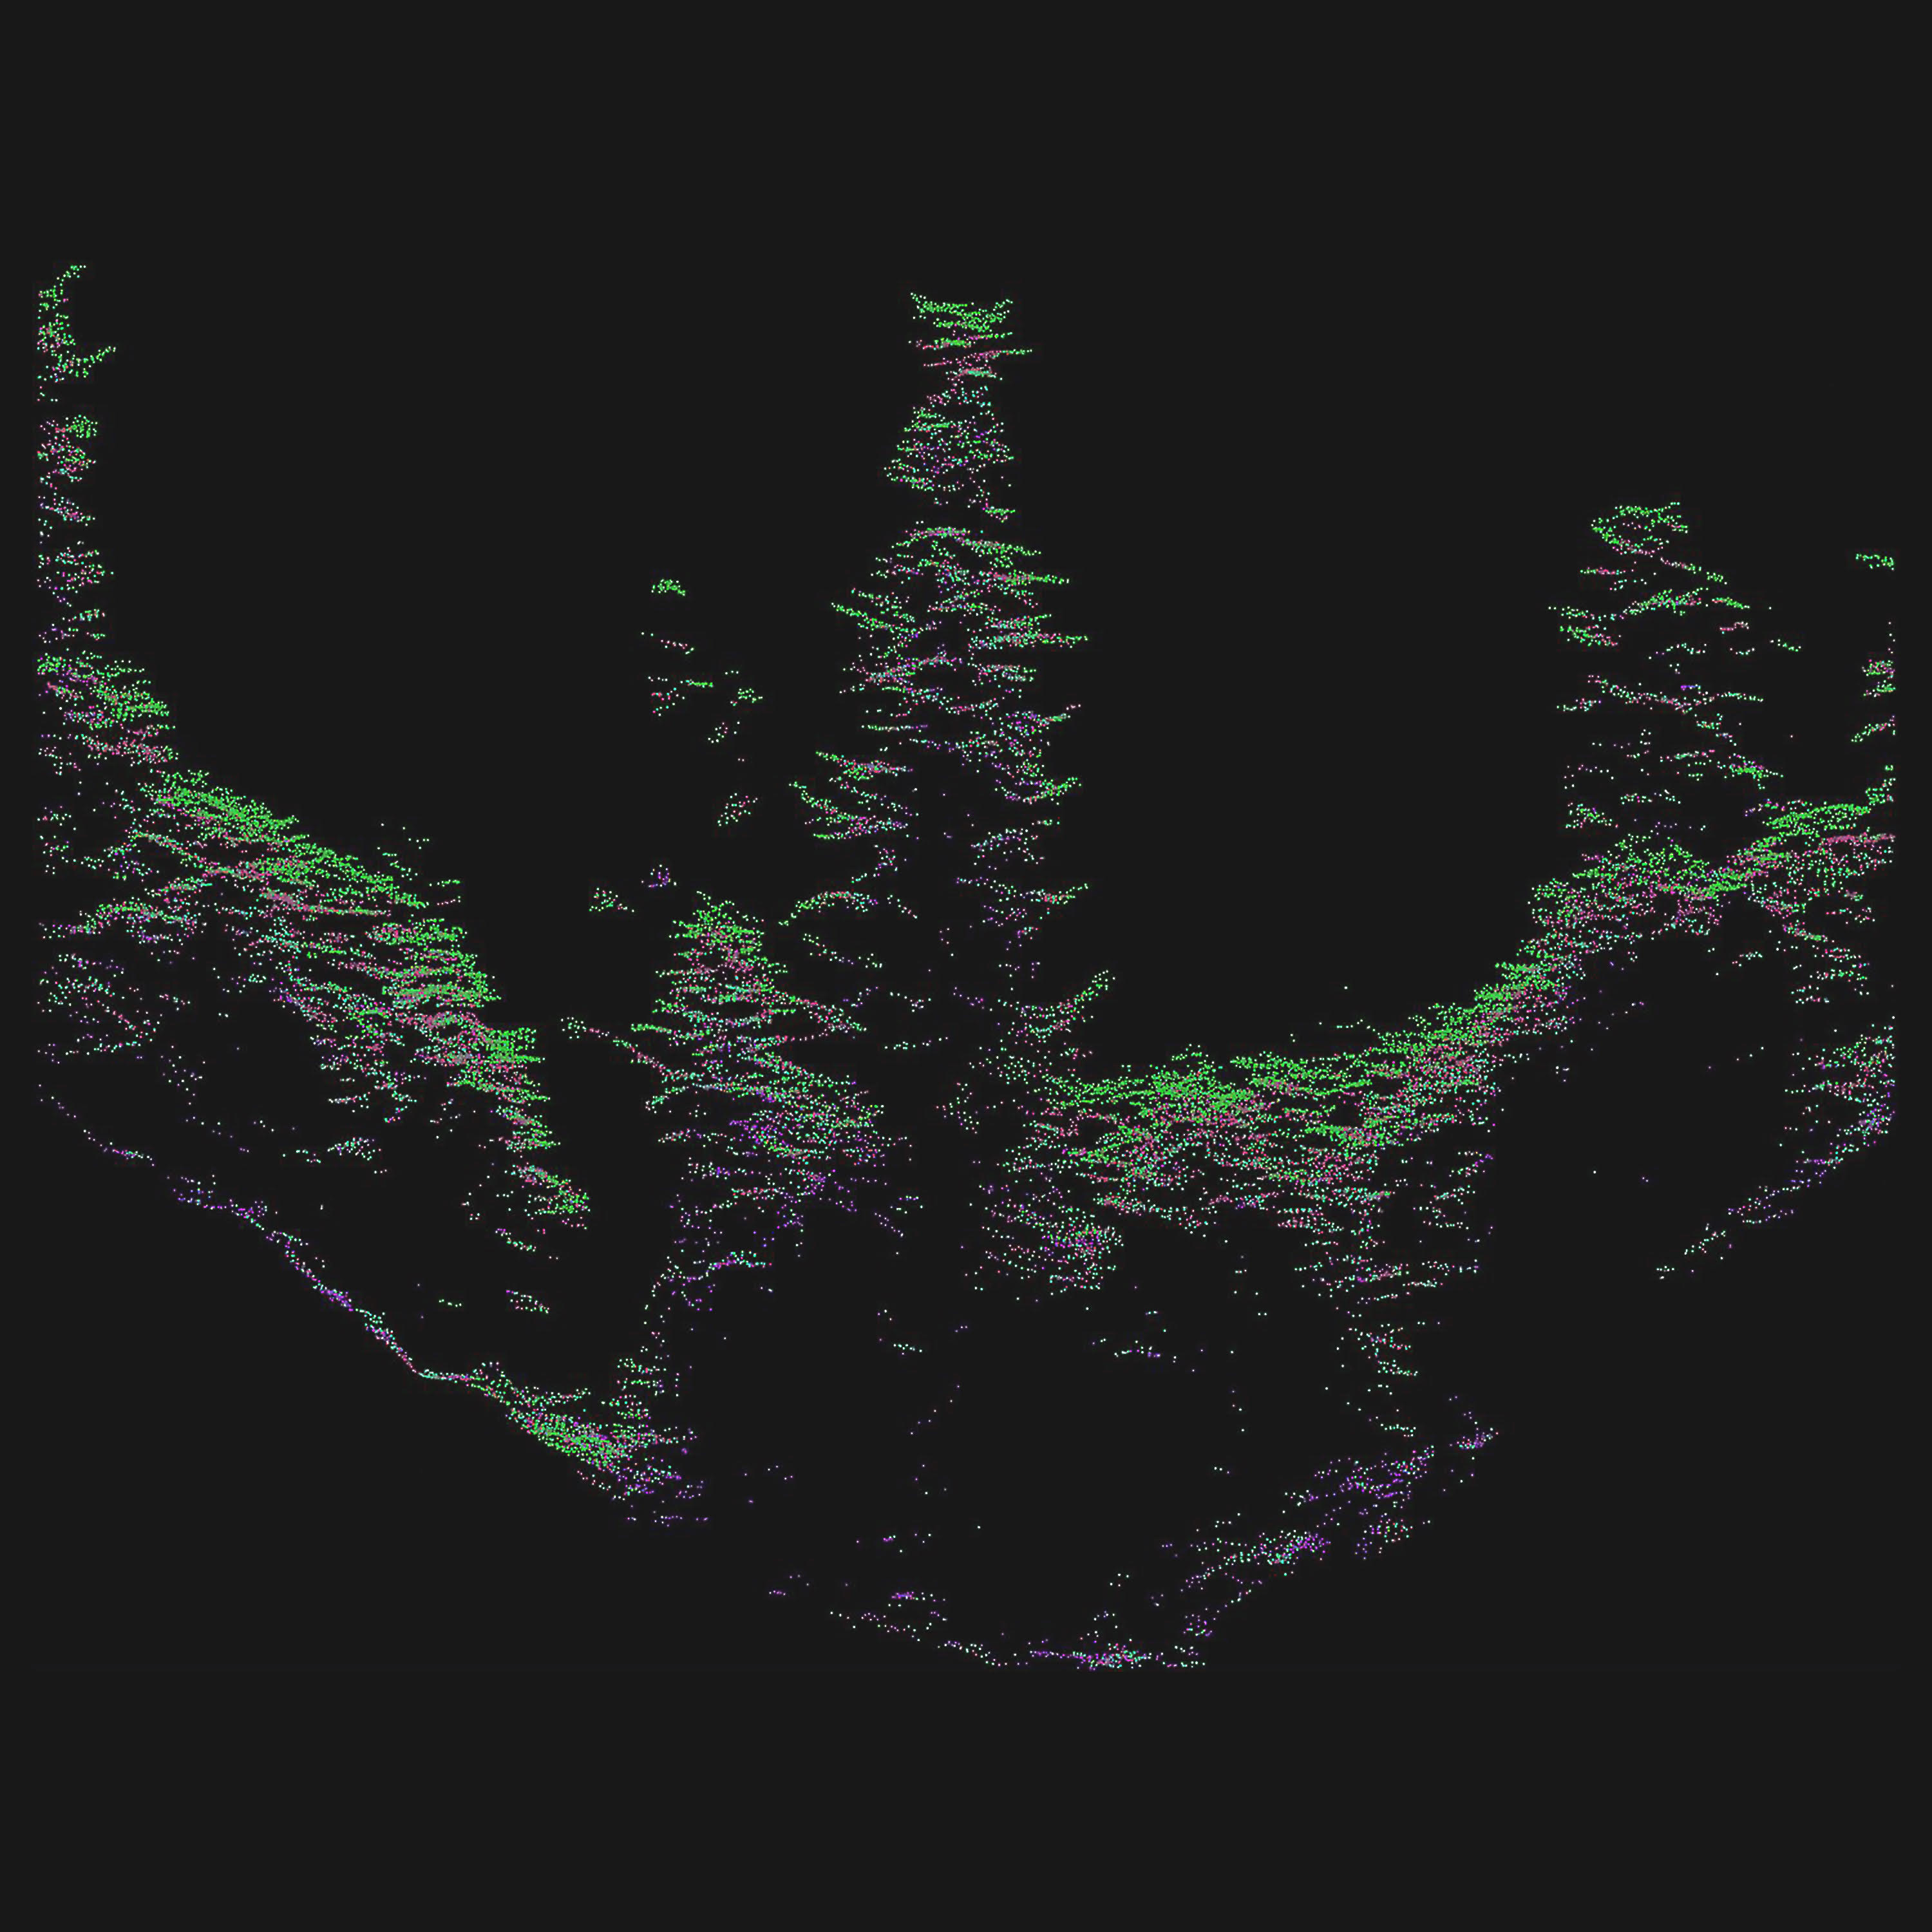
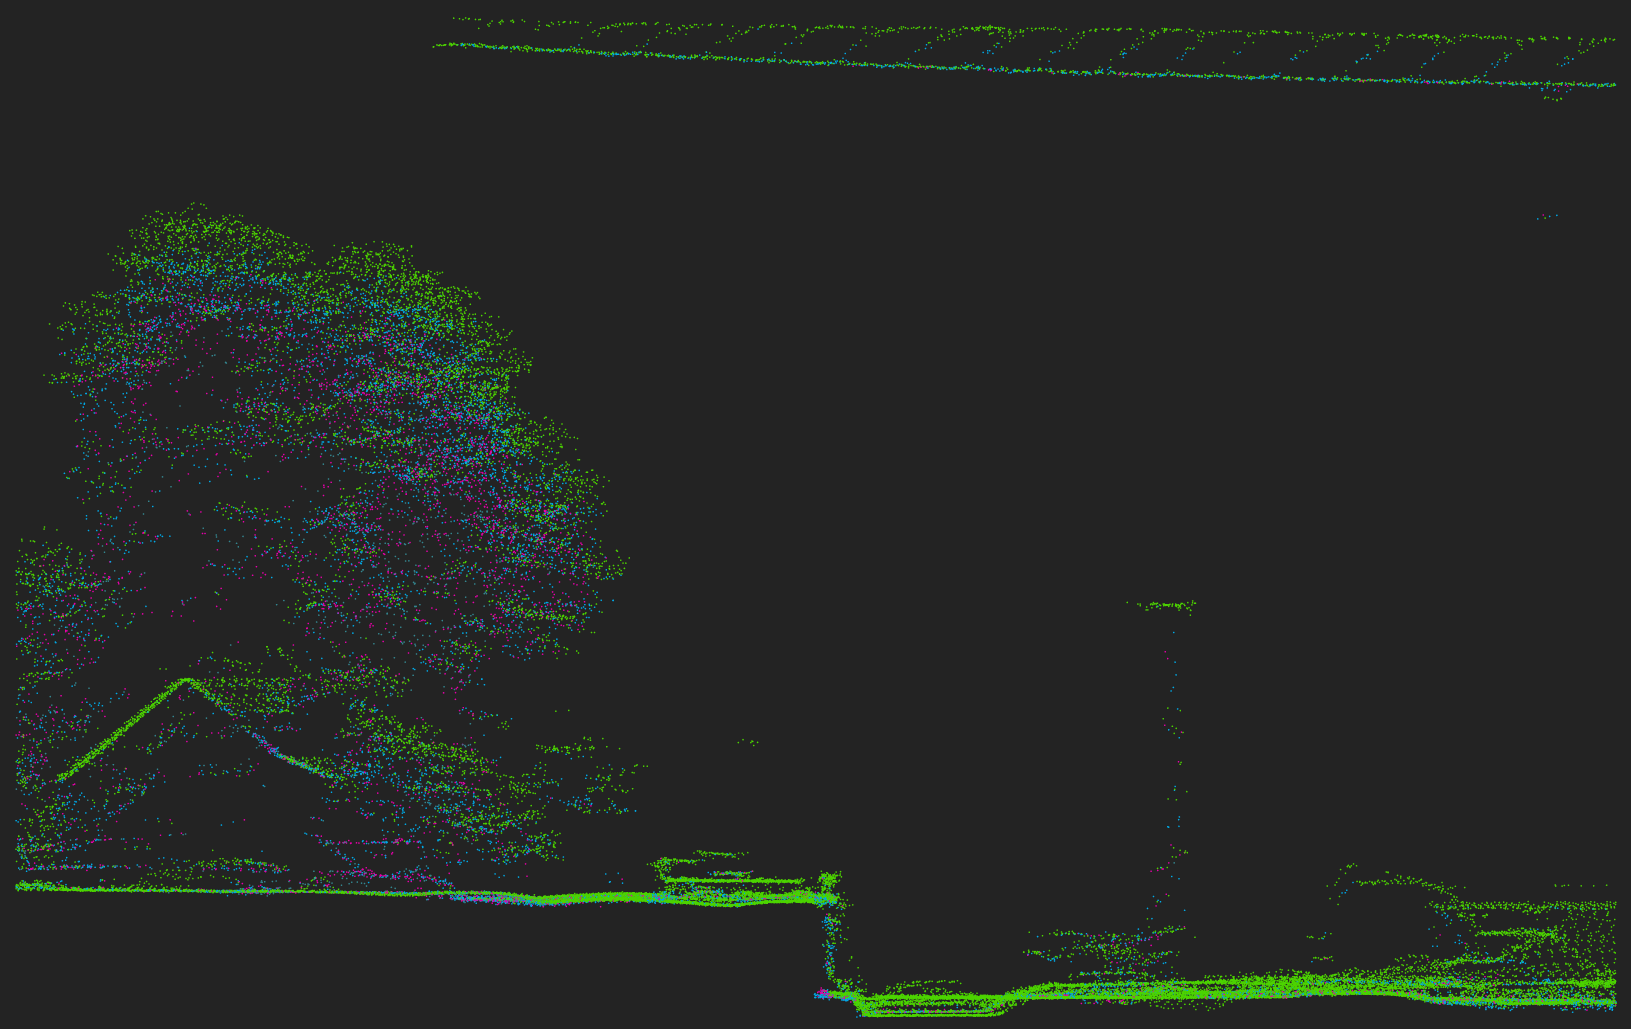
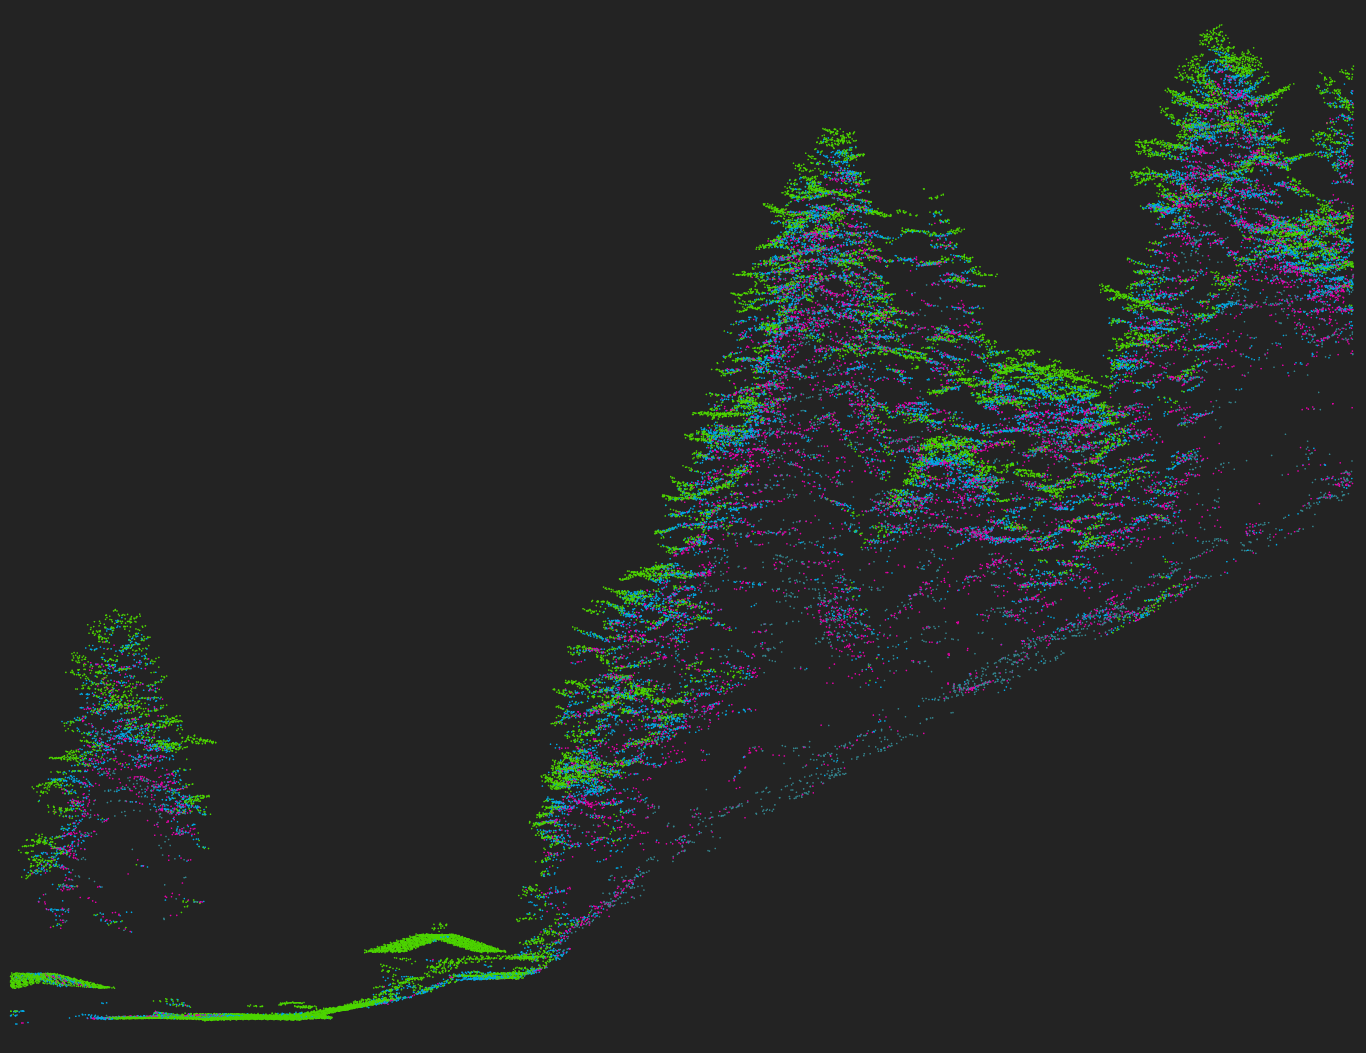
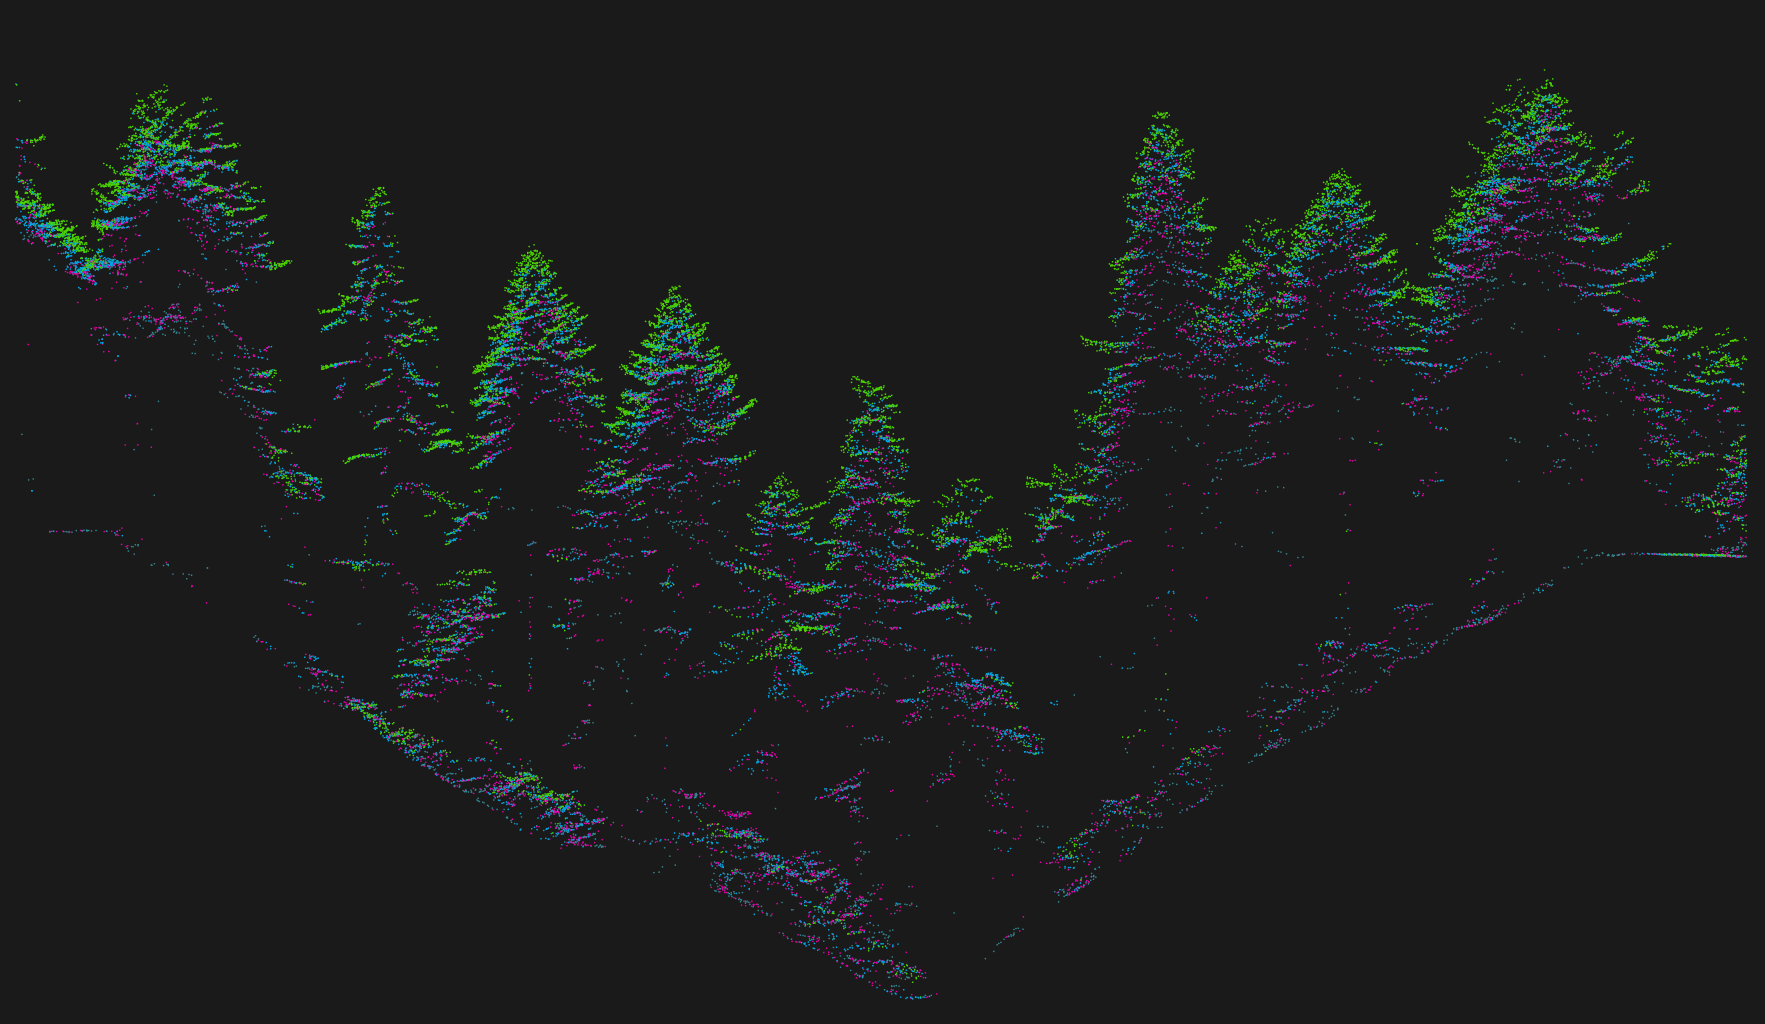
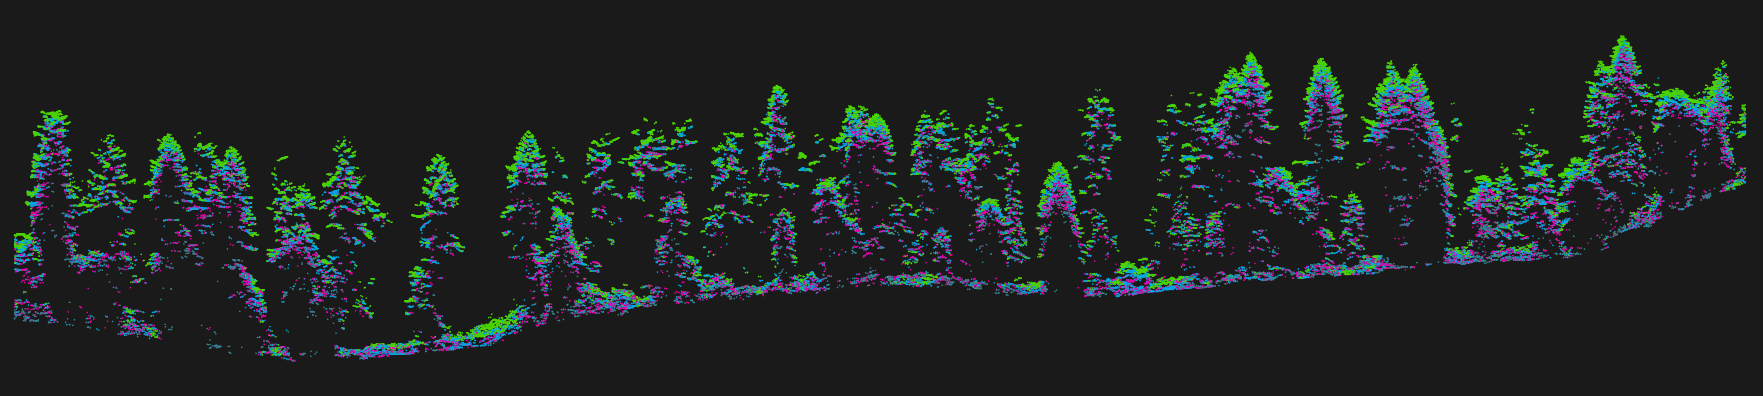
- Identify every tree crown.
Steps:
- Identify every tree crown.
- Describe each tree crown.
Machine Learning-derived evergreen/deciduous classification (~90% accuracy). Collaboration with Metro. Open Data.
Informing Statistical Models with Tree Data
Air quality - NO2 Modeling
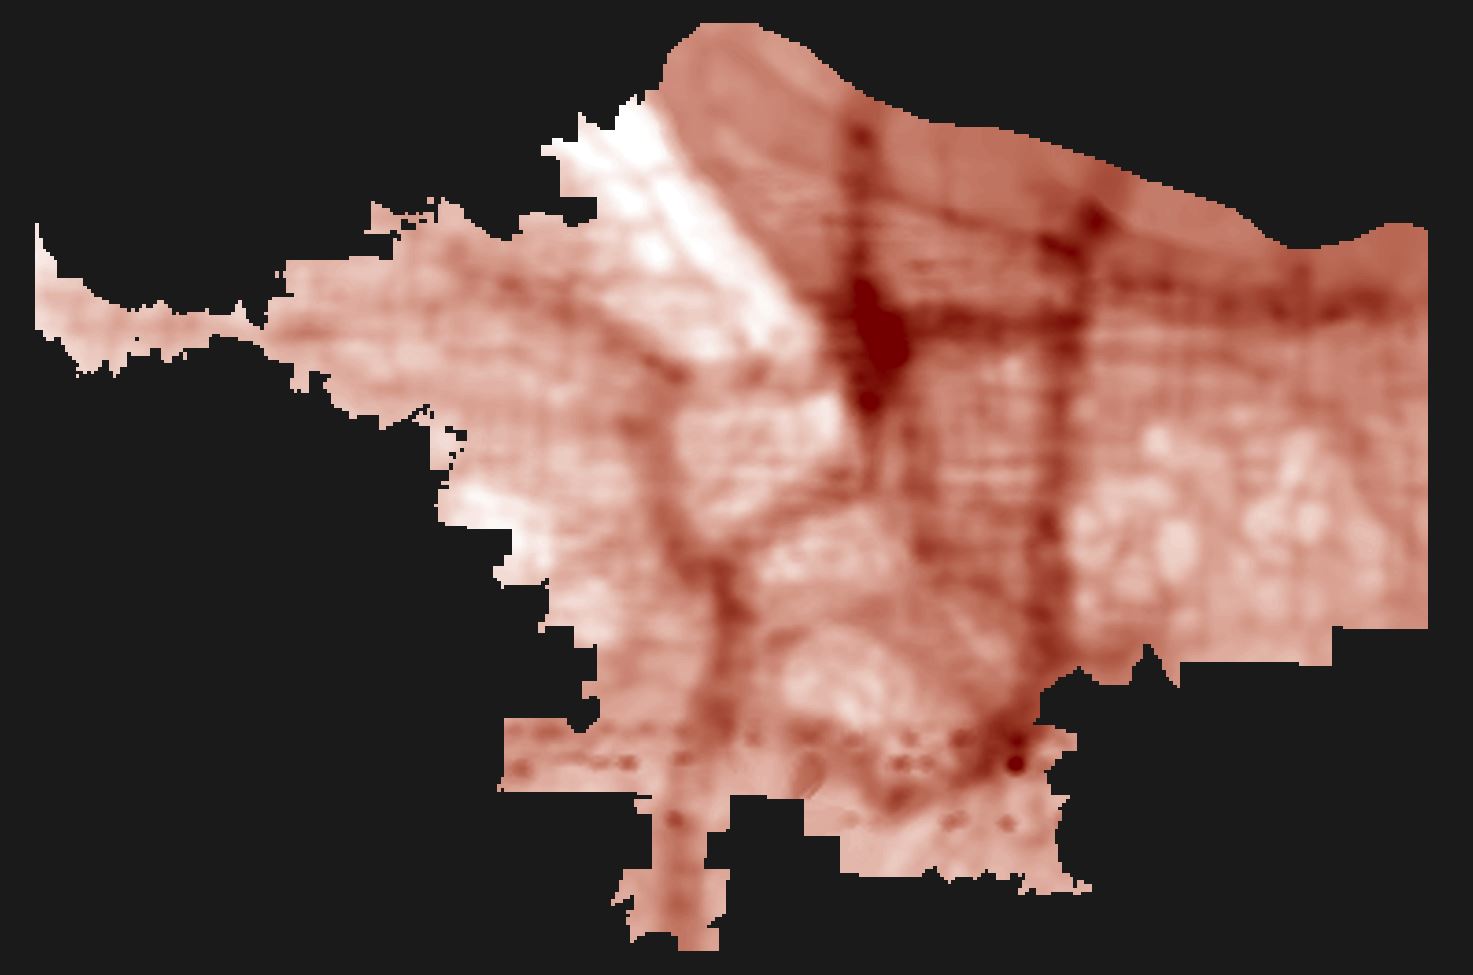
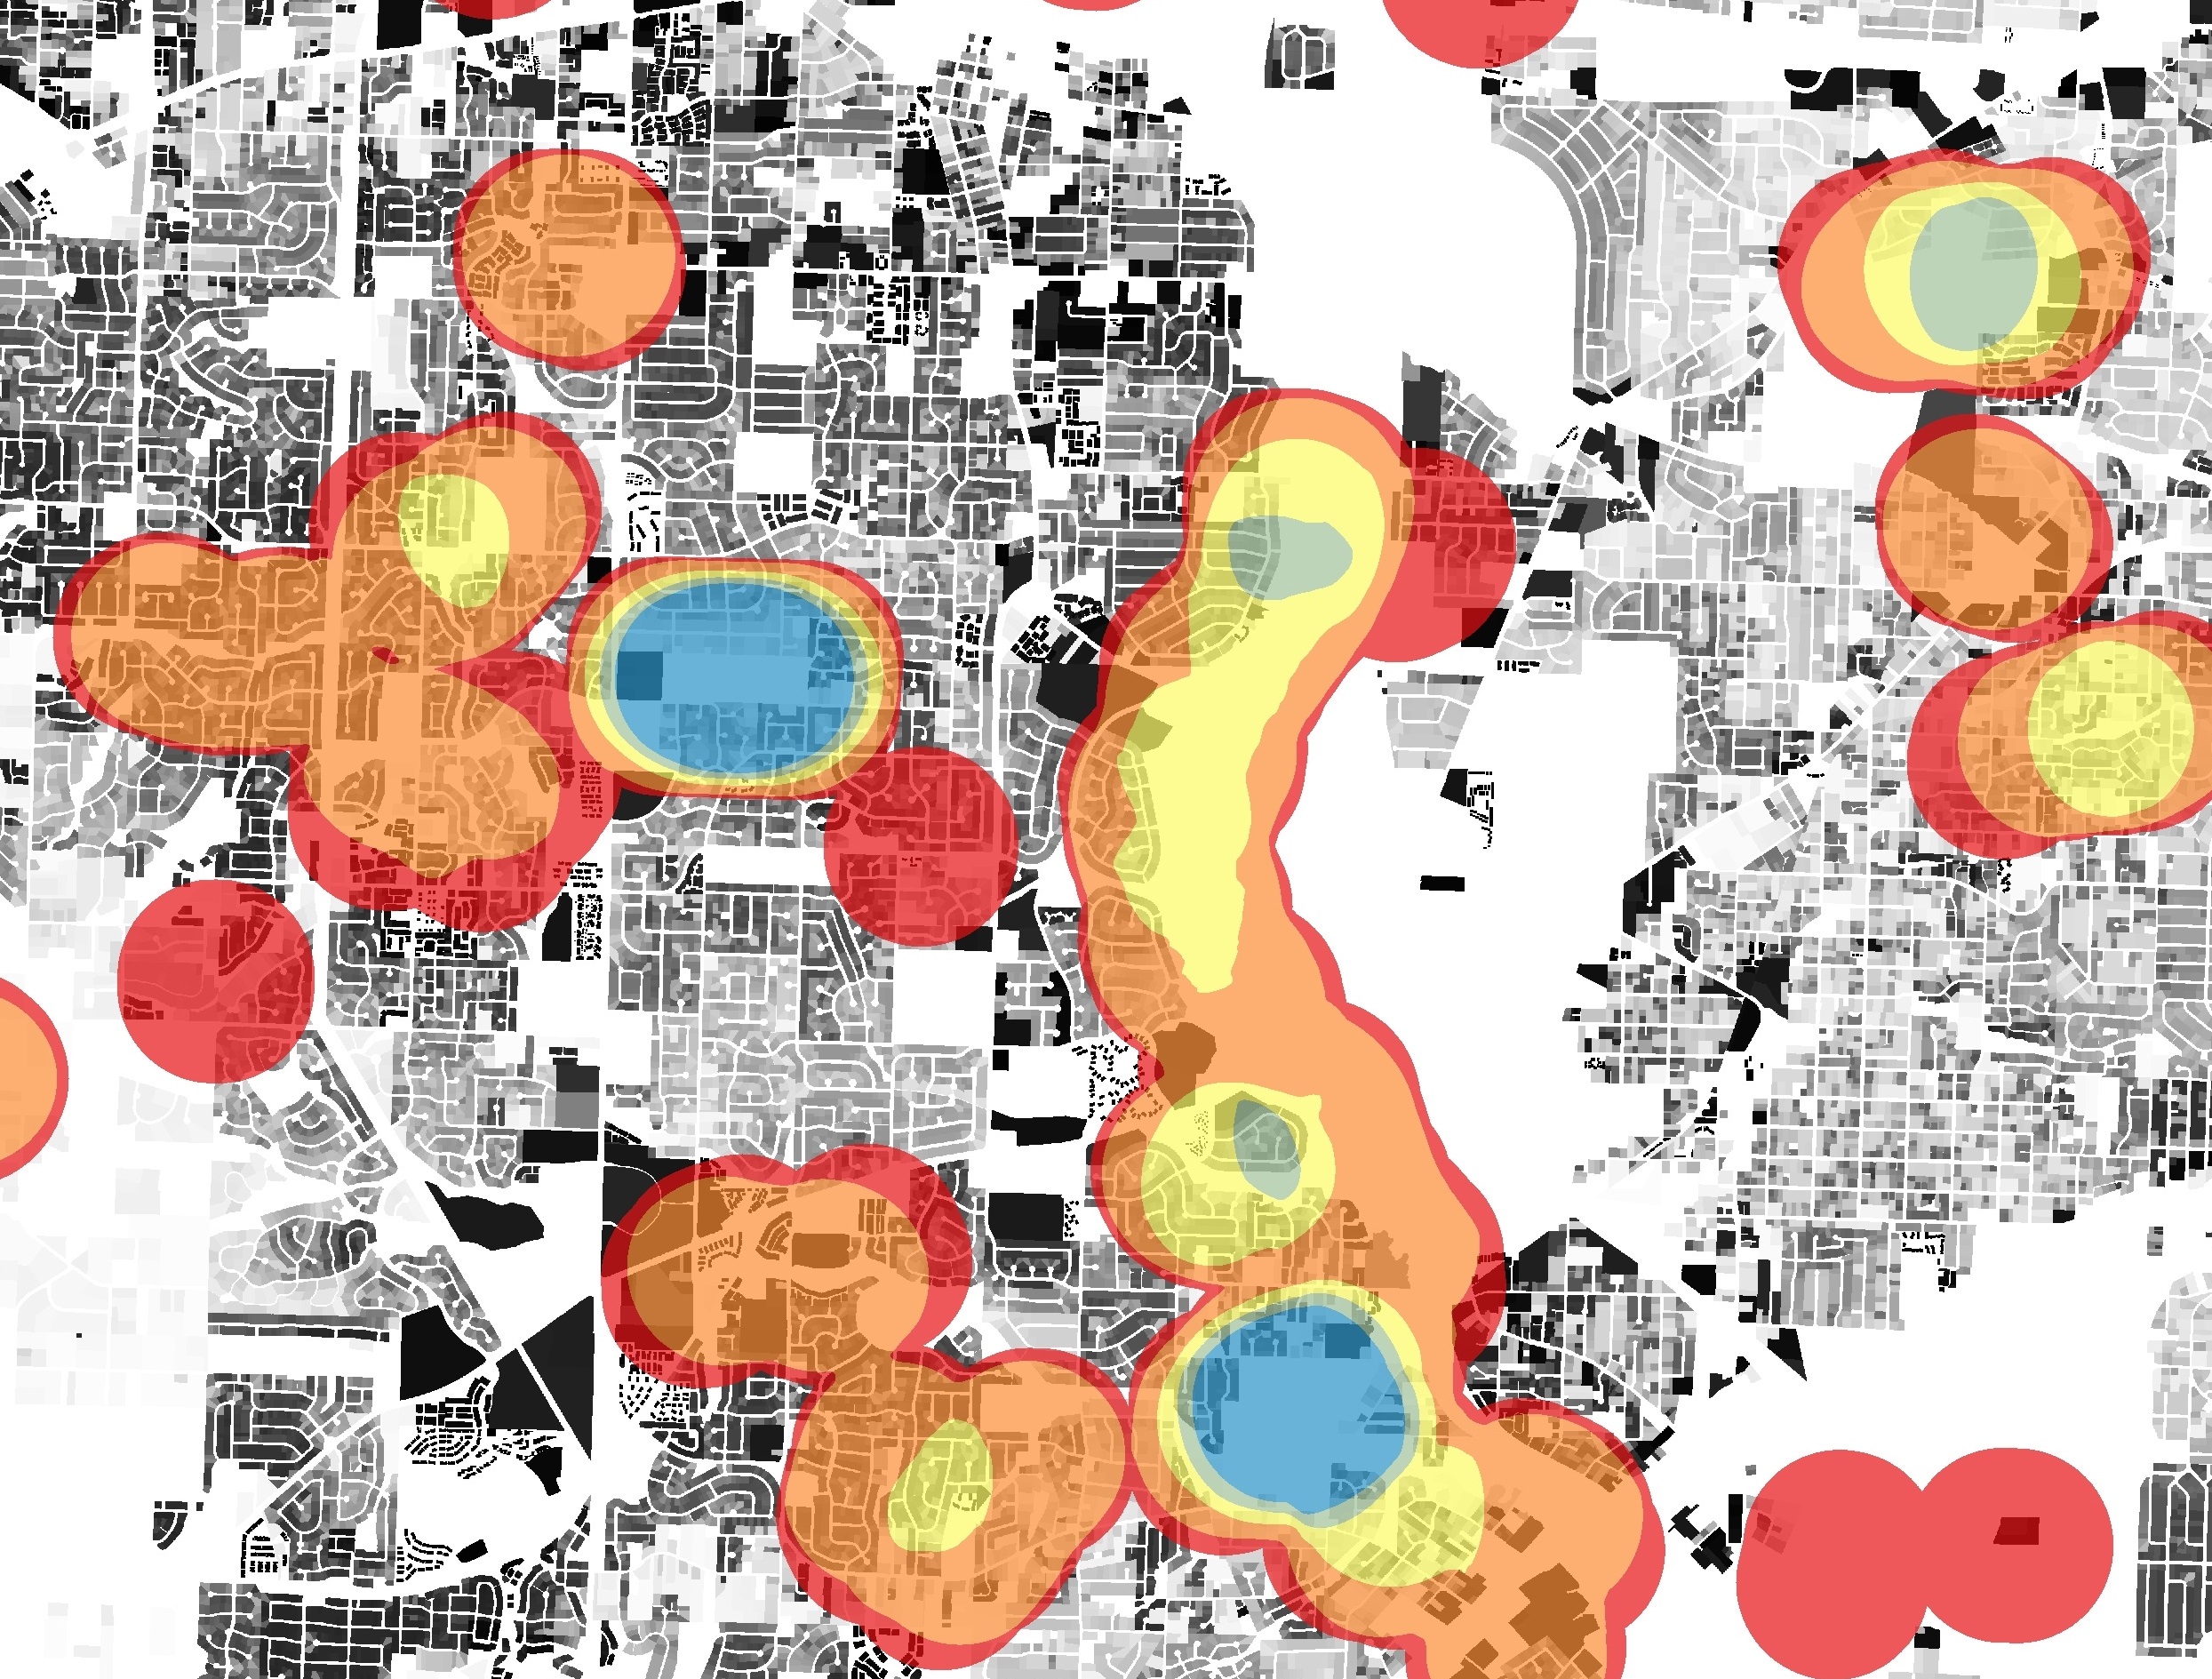
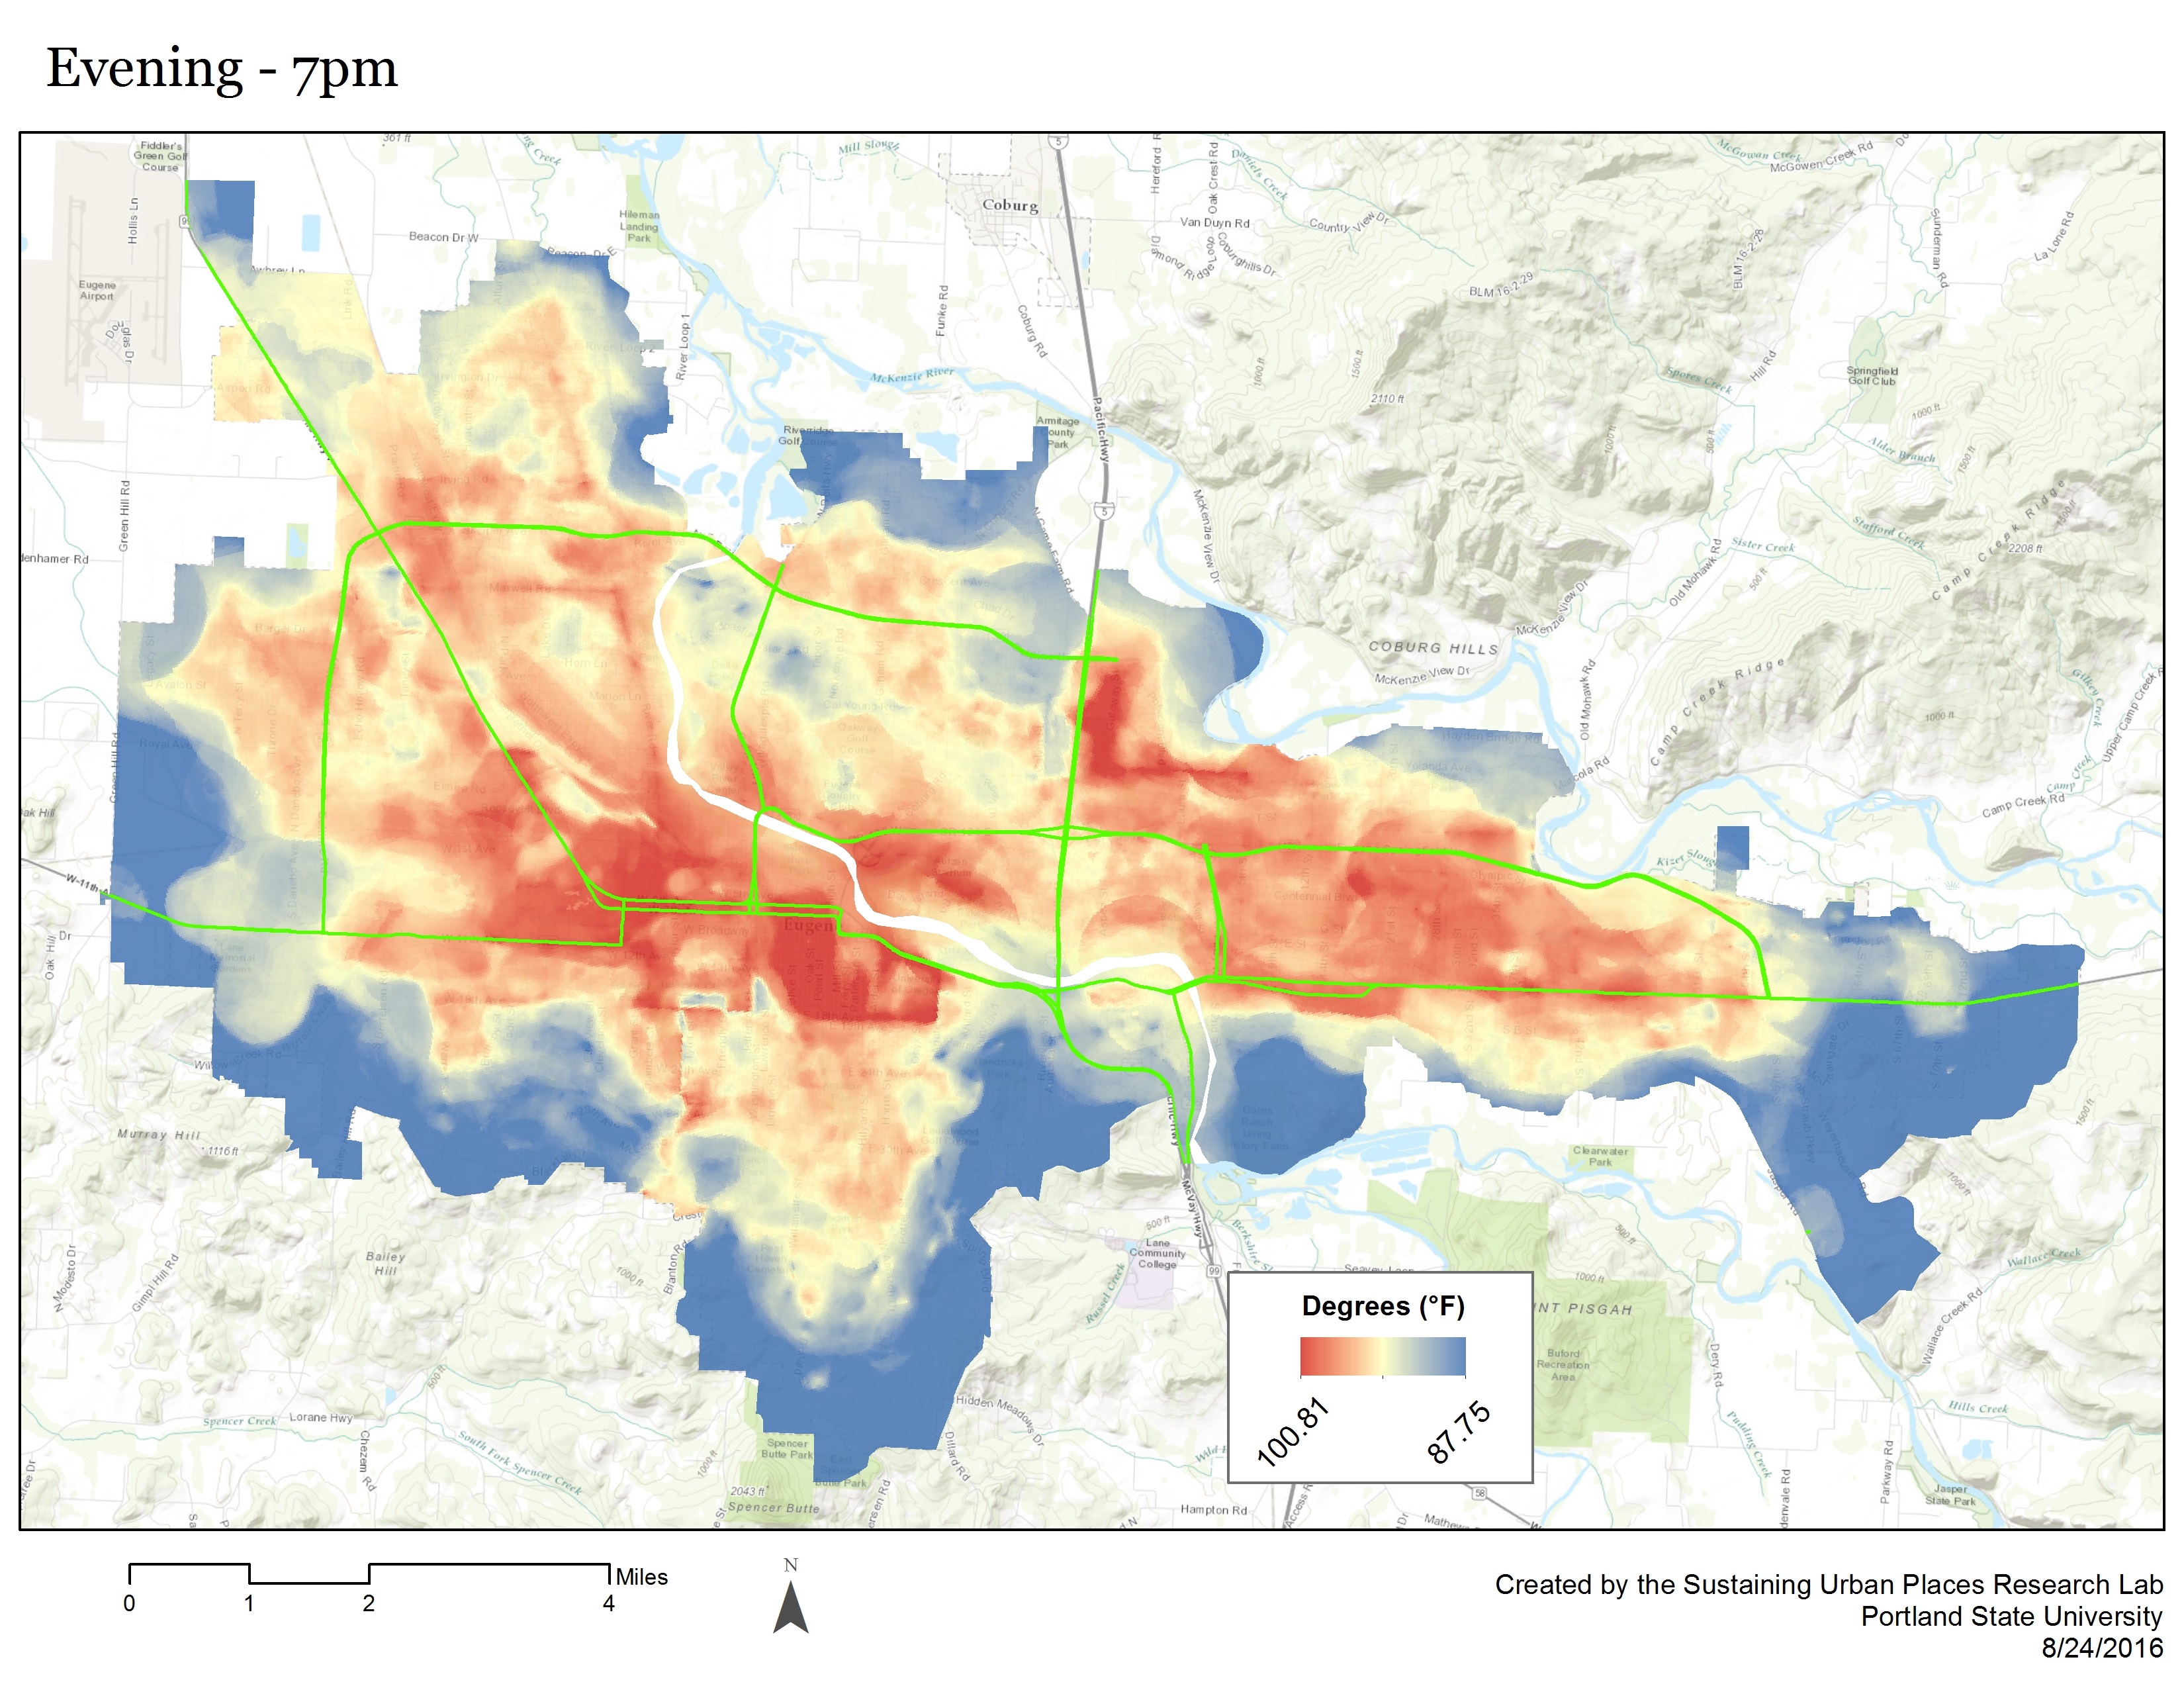
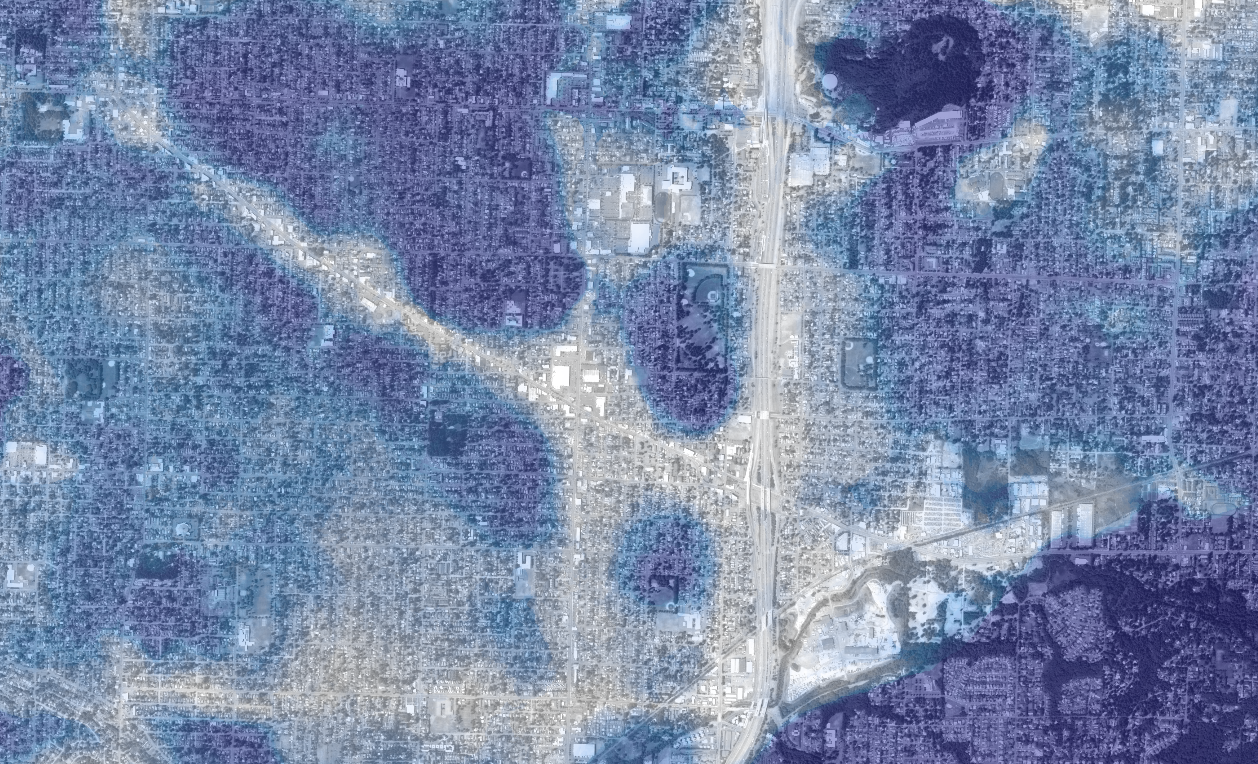
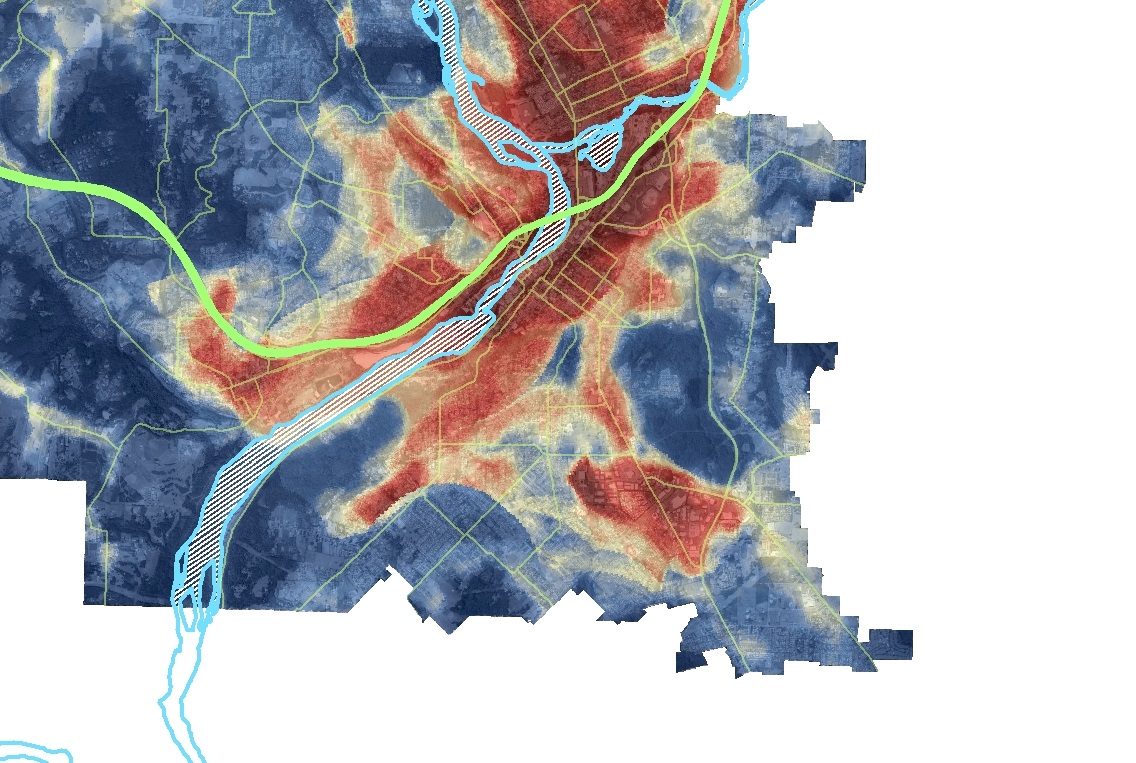
Urban Heat Islands
Multi-temporal traverse-based modeling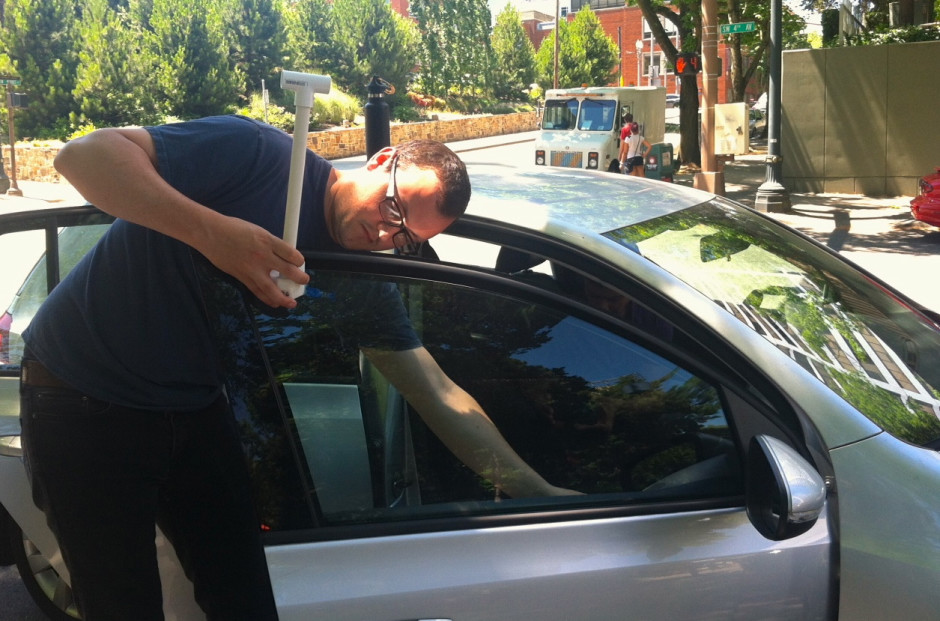
Predictive Heat Surfaces Estimated with Machine Learning Alogrithms

Assessing the Role of Canopy in Temperature Reduction
Current Progress of UHI Research
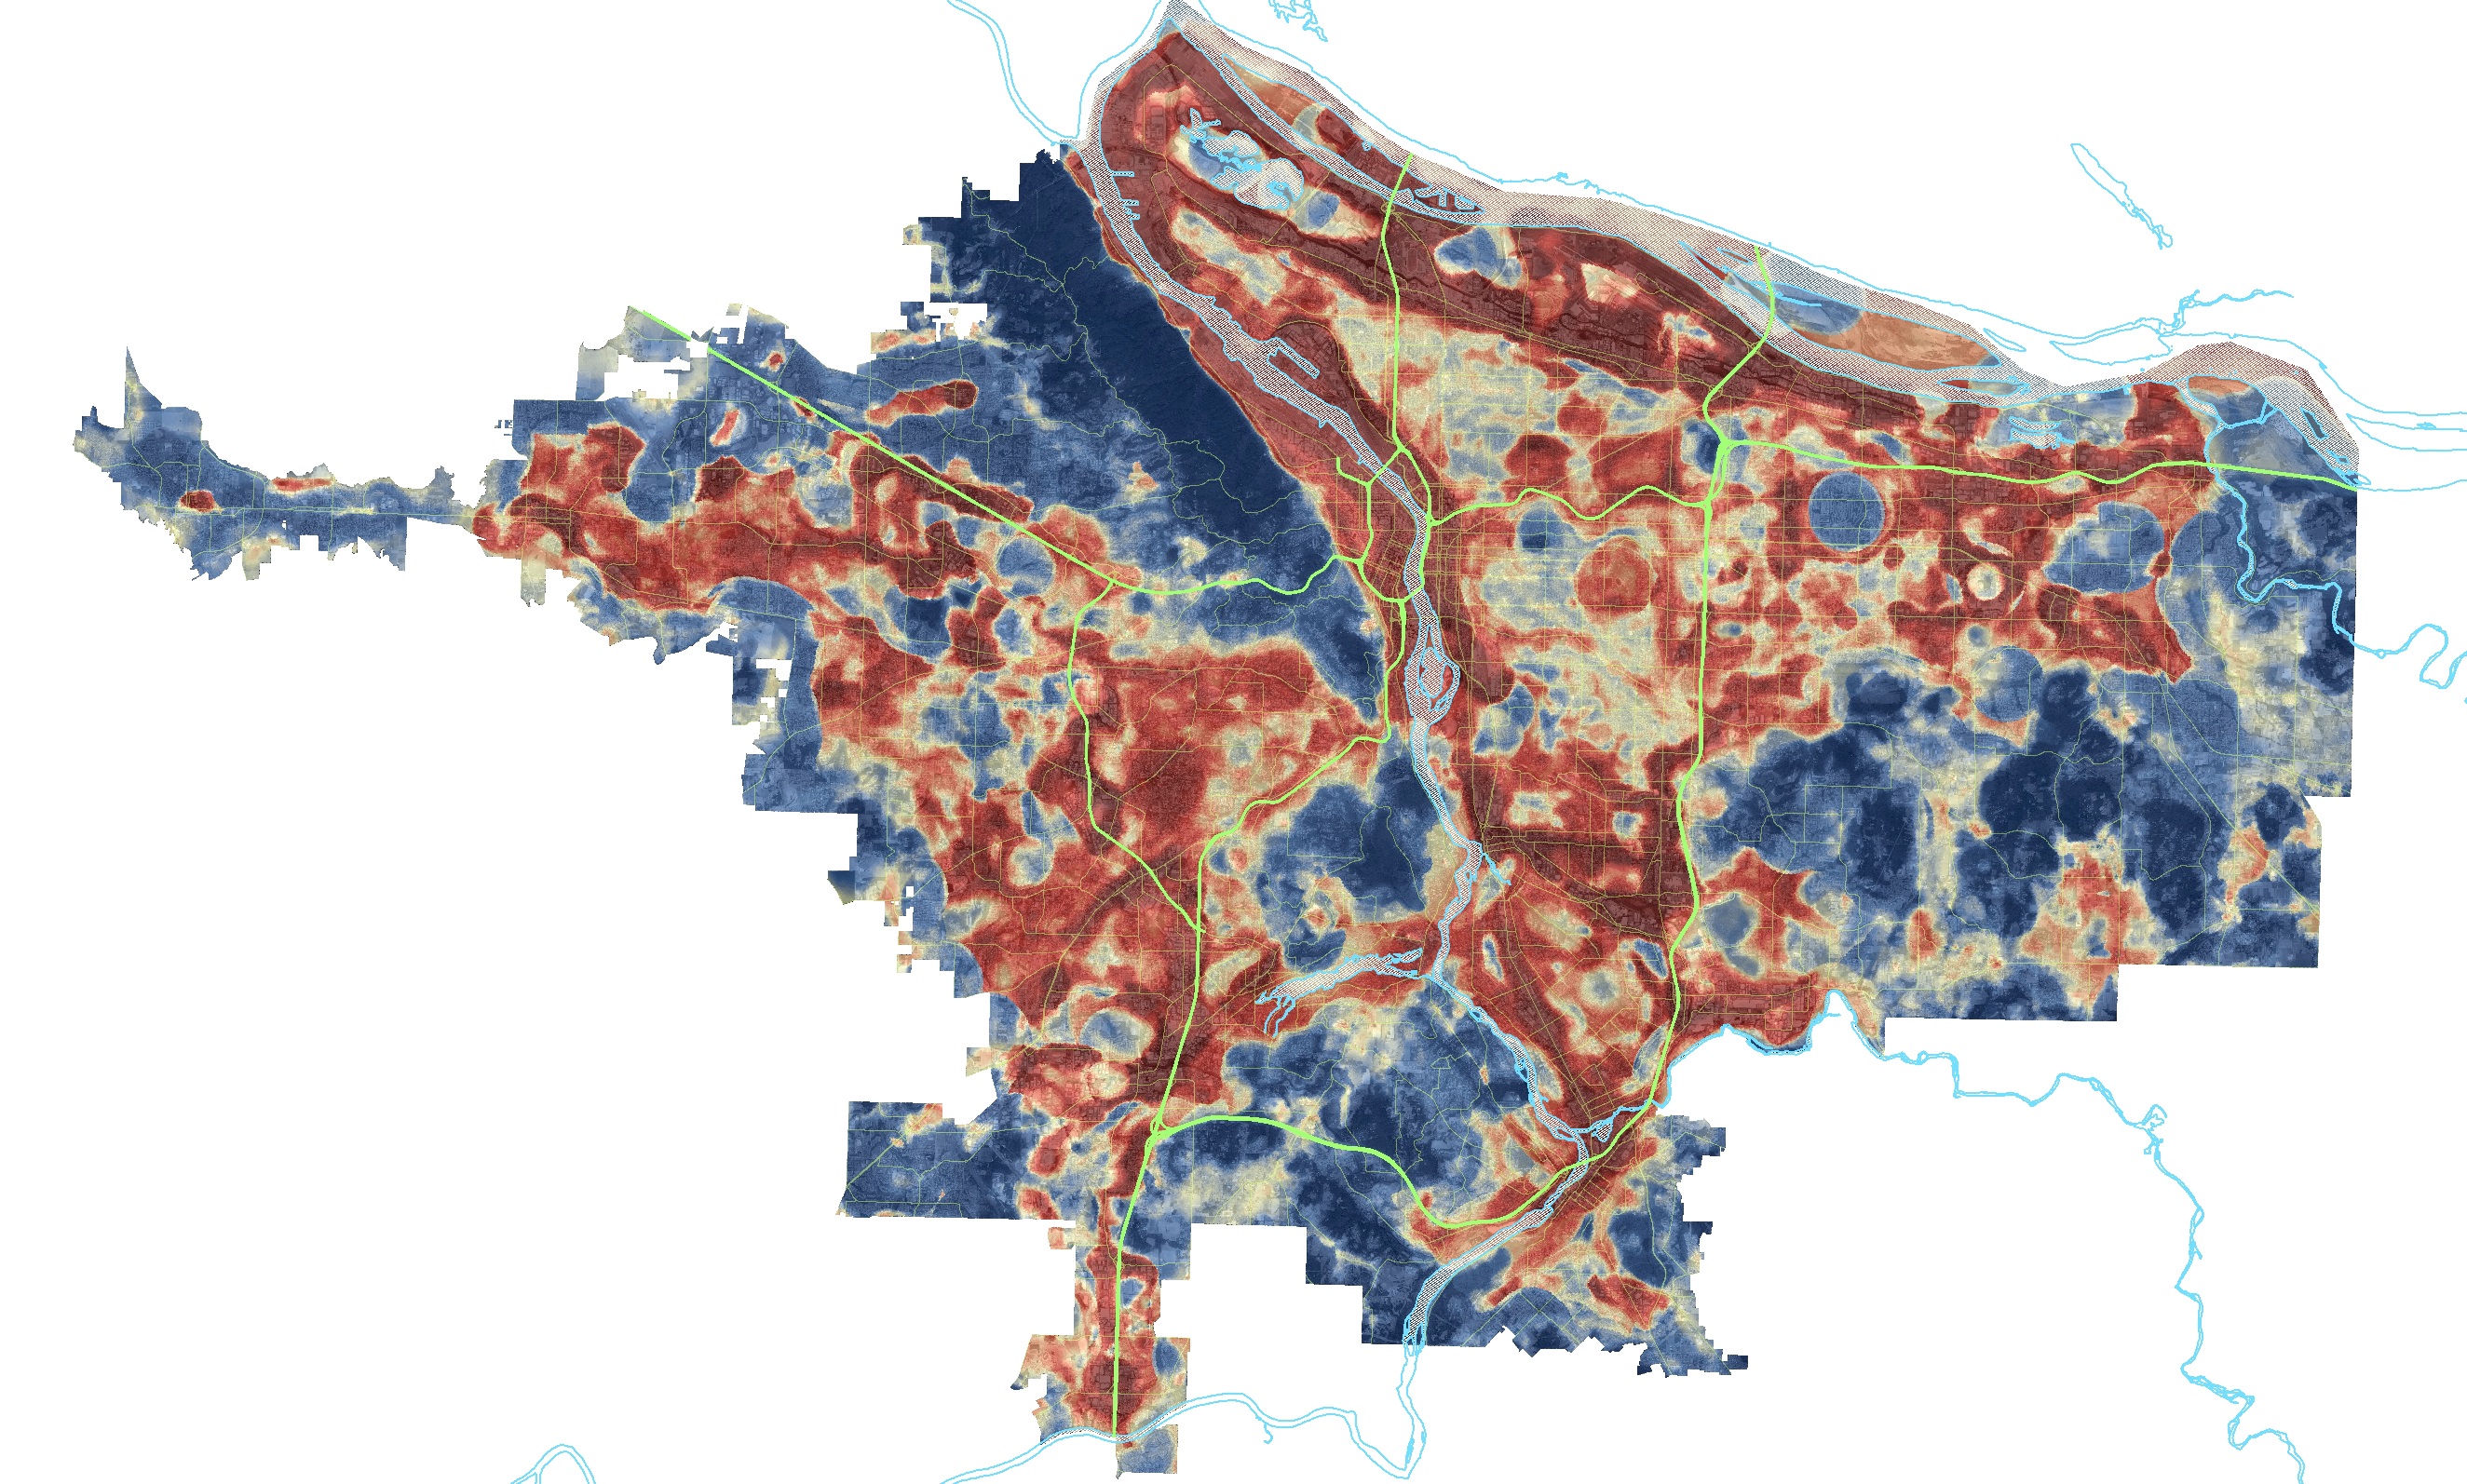
Current Progress of UHI Research
The Canopy Analytics Tool
We know where all of the trees are!
Moving Forward
What do we hope to accomplish?
- Increase public knowledge of the impact of trees.
- Educate policy makers to the connections trees have to the environment
- Nominate for Herritage Tree status that play major roles in:
- Reduction in the Urban Heat Island Effect
- Reduction in air pollutants
Future research
- More modeling!
- Tree species descriptions
- Explore the relationships between tree type and Air Quality / UHI
- New LiDAR: change detection
- permitted removals
- ... non-permitted removals
- Move beyond the Portland Metropolitan Area
Eugene, Oregon UHI Research